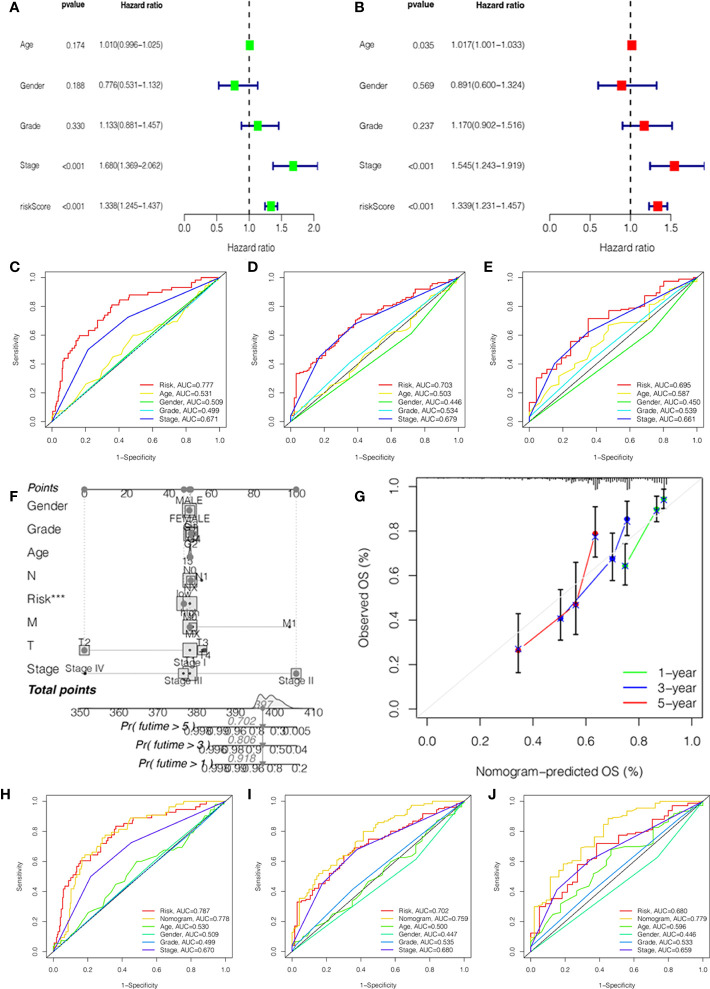
Figure 3.
Independent prognostic value validation. (A) The relationship between the risk score and clinicopathological features by univariate Cox analysis. (B) The relationship between the risk score and clinicopathological features by multivariate Cox analysis. The AUC values of the ROC curve of 1 (C), 3 (D), and 5 years (E) for the risk score and clinicopathological features. (F) Nomogram for 1-, 3-, and 5-year OS prediction. (G) Calibration curves for 1-, 3-, and 5-year OS prediction. (H-J) The AUC values of the ROC curve of 1, 3, and 5 years for the nomogram.

