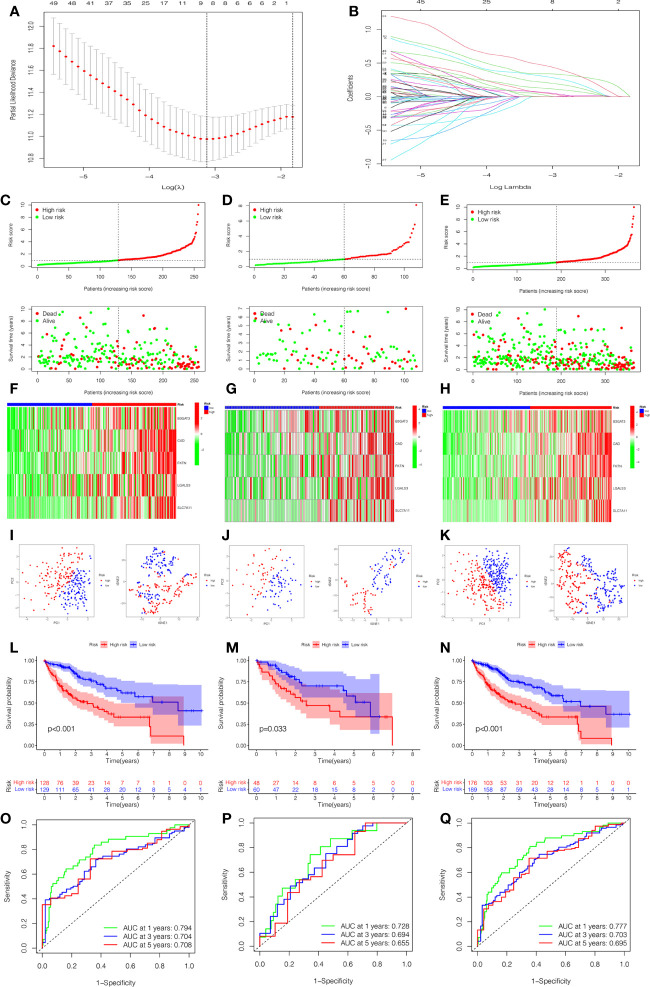
Figure 5.
Construction and estimation of the glycosylation-related signature. (A) LASSO coefficient distribution of the glycosylation-related signature. (B) The optimal parameter (λ) selection by the cross-validation curve. The distribution and survival status of the risk score in the training cohort (C), testing cohort (D), and total cohort (E). Heatmap of five-gene expression between low- and high-risk groups in the training cohort (F), testing cohort (G), and total cohort (H). The PCA and t-SNE analysis in the training cohort (I), testing cohort (J), and total cohort (K). (L–N) The K-M survival analysis between low- and high-risk groups in the training cohort (L), testing cohort (M), and total cohort (N). The AUC values of ROC curves for 1, 3, and 5 years in the model in the training cohort (O), testing cohort (P), and total cohort (Q).

