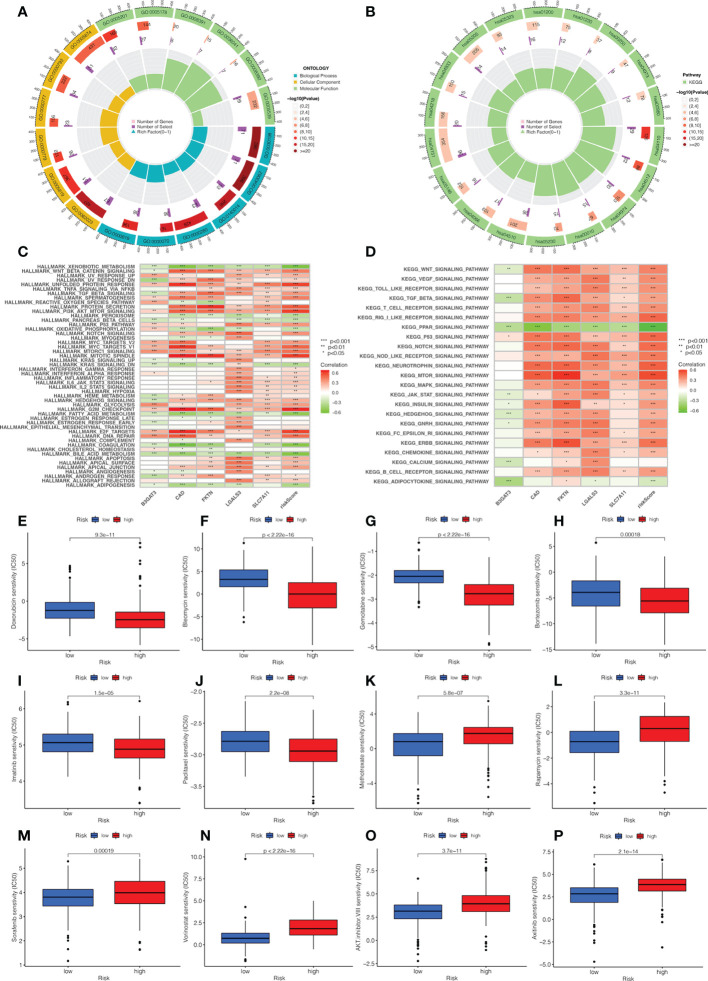
Figure 7.
Analysis of functional enrichment and application of the signature in drug sensitivity. (A) The GO analysis by a chordal graph. (B) The KEGG analysis between low- and high-risk groups by a chordal graph. (C) The hallmark processes by GSVA analysis in five genes by GSVA analysis. (D) The KEGG signaling pathway by GSVA analysis. The association between drug sensitivity and low- and high-risk groups: (E) Doxorubicin. (F) Bleomycin. (G) Gemcitabine. (H) Bortezomib. (I) Imatinib. (J) Paclitaxel. (K) Methotrexate. (L) Rapamycin. (M) Sorafenib. (N) Vorinostat. (O) AKT.inhibitor VIII. (P) Axitinib.

