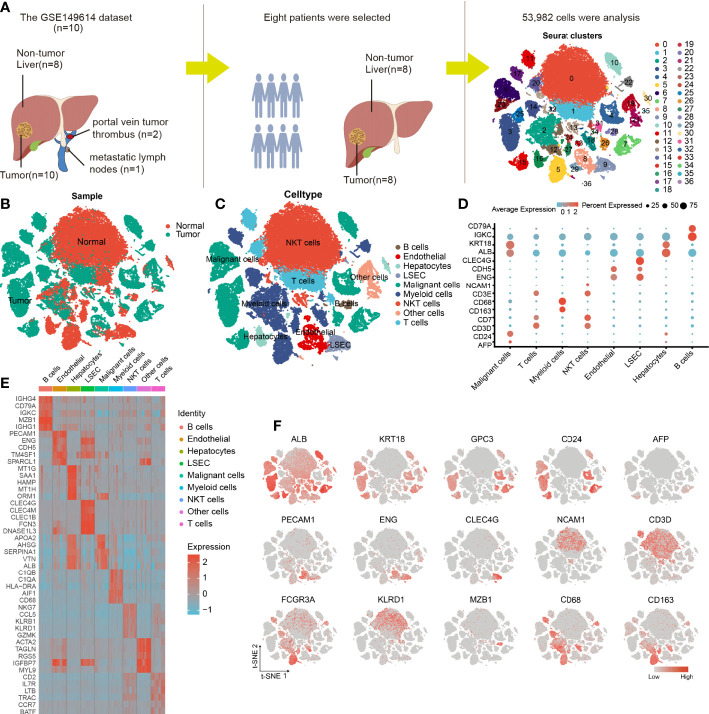
Figure 2.
Cellular annotation of scRNA-seq data for tumor and adjacent liver tissue samples from 8 patients. (A) Processing procedure of GSE149614 scRNA-seq dataset and t-SNE distribution of 53,982 cells. (B) The cluster map illustrates the cell origins by color (non-tumor liver and HCC samples). (C) The t-SNE plot shows the 8 identified cell types and 1 undefined cell type (annotated as other cells) from 10× Genomics. (D) The bubble plot displaying the normalized expression levels of selected marker genes across the 9 clusters, the variation from high to low expression is represented by the colors from orange to blue. (E) Heatmap of top 5 DEGs in the identified cell types. (F) Feature t-SNE plots showing the expression levels of 15 well-known marker genes.

