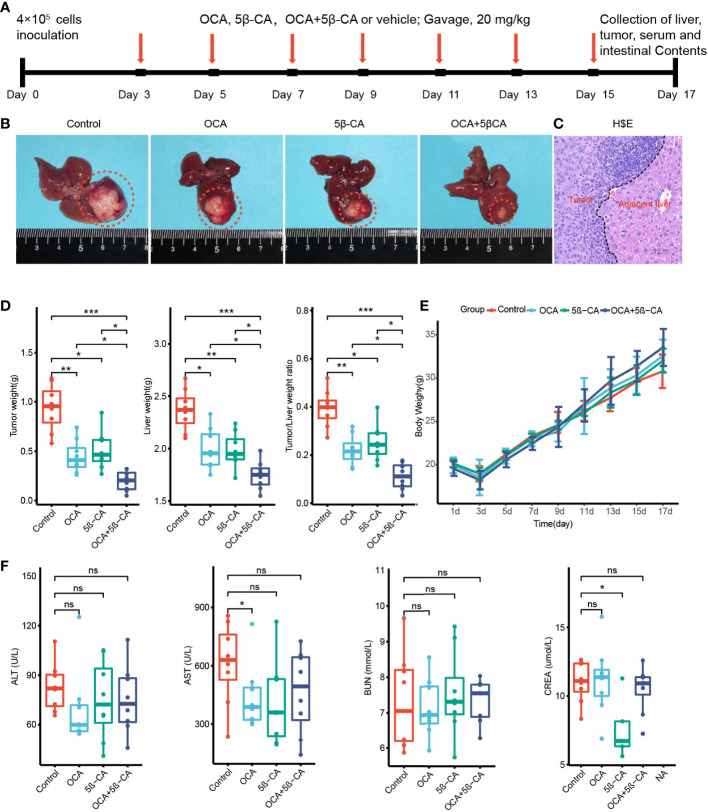
Figure 6.
OCA combined with 5β-CA significantly inhibited orthotopic H22 liver tumor. (A) The experimental flow chart. (B) Representative liver images in the 4 groups are shown. The tumors were outlined with an orange dashed curve. (C) The orthotopic H22 mice model was assessed by H&E images. A black dashed line outlines the border between the tumor and the non-tumor liver. (D) The liver weight, tumor weight and the ratios of tumor/liver weight from 4 groups were recorded while mice were executed. (E) The body weight variation. (F) Tumor-induced liver injury, drug-induced hepatotoxicity or drug-induced liver protective effect was assessed by serum levels of ALT and AST. Drug-induced nephrotoxicity was assessed by BUN and CREA (ns, no significance; *0.01 ≤ P value < 0.05; **0.001 ≤ P value < 0.01; ***P value < 0.001).

