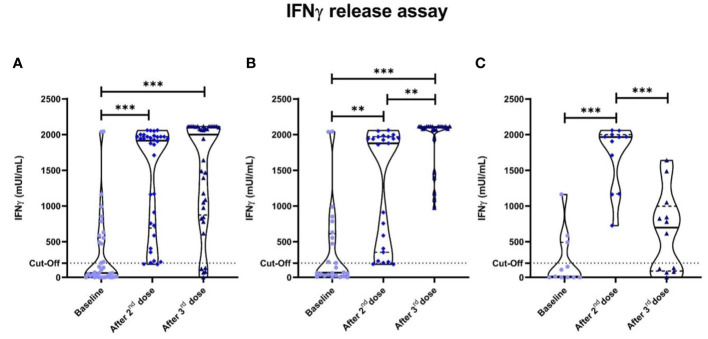
Figure 2.
Specific anti-SARS-CoV-2 IFN-γ responses measured by IGRA. Dotted lines represent positivity cut-off: ≥200 mUI/ml. (A) All cancer patients. Significant differences were seen in cancer patients between the baseline anti-SARS-CoV-2 IFN-γ titres and after the second (p<0.001) and third vaccine doses (p<0.001). Two groups were established after the third dose according to the pattern of cellular behavior: one that enhanced their IFN-γ titres after the third vaccine dose (Group 1); and Group 2 that displayed a drastic fall-off of specific anti-SARS-CoV-2 IFN-γ titres. (B) Group 1 cancer patients. (C) Group 2 cancer patients. *P<0.05 **P<0.01 ***P<0.001.

