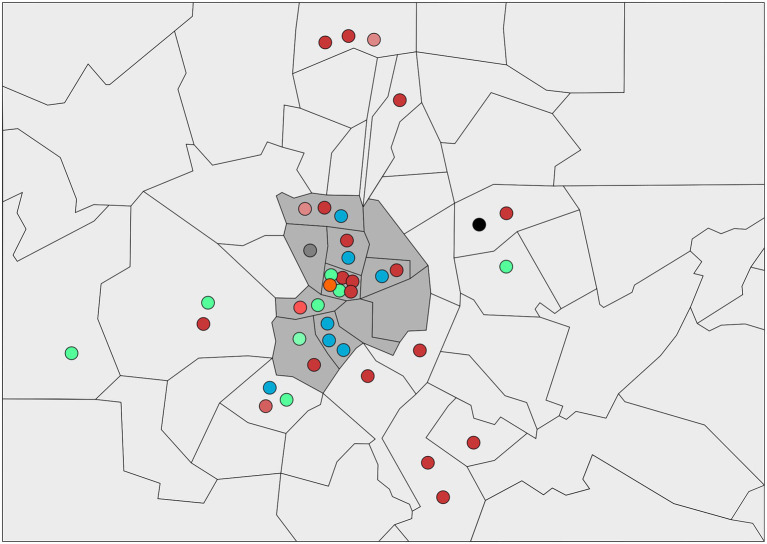
Figure 5.
Schematic representation of the districts of Madrid where LGV cases were identified. The different circles correspond to the L2b variants detected in the study. Each color represents a different variant. The black circle corresponds to the L2b variant reported in Netherlands; red-tone circles correspond to L2b-ompA L2 variants; blue-tone circles correspond to L2bV1 variants and green-tone circles correspond to L2bV7 variants. The central district is identified in grey background.

