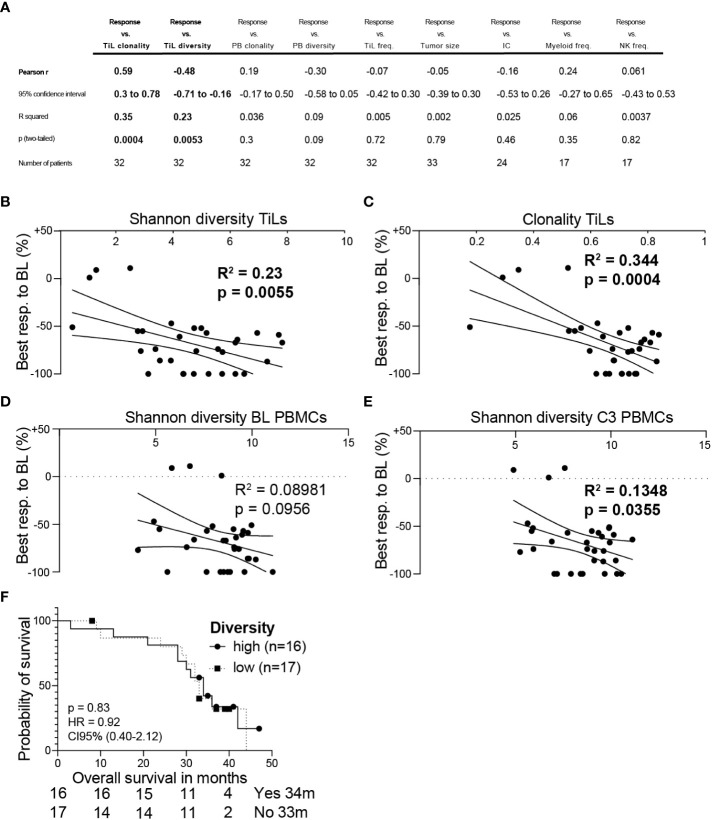
Figure 3.
(A) Multi linear correlation analysis of indicated markers with the best radiological response. Shannon diversity of TiLs (B) or clonality of TiLs (C) was correlated with radiological response. Shannon diversity of baseline (BL) PBMCs (D) or PBMCs after three cycles of chemotherapy (E) was correlated with radiological response. (F) The analyzed cohort was separated into patients having a higher than median TiL diversity vs. lower TiL diversity. Overall survival is shown in the Kaplan-Meier estimator. Multi linear correlation and Pearsons´s r (A), simple linear regression (B–E) or log-rank Mantel-cox test (F) was calculated. P values are indicated.

