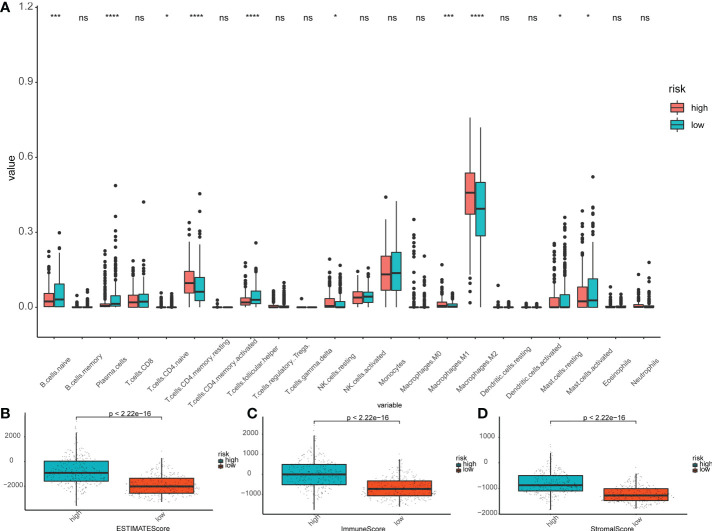
Figure 6.
Immunoassay in the risk subgroups. (A) Boxplot showing the differential abundance of 22 infiltrating immune cells calculated by CIBERSORT between the high- and low-risk groups in LGG. ∗P< 0.05; ∗∗∗P< 0.001; ∗∗∗∗P< 0.0001; ns: not significant. (B-D) The higher expression level of Estimate Scores (B), Immune Score (C), and Stroma Score (D) correlated with the high-risk group. The green box shows the low-risk group, and the red box shows the high-risk group.

