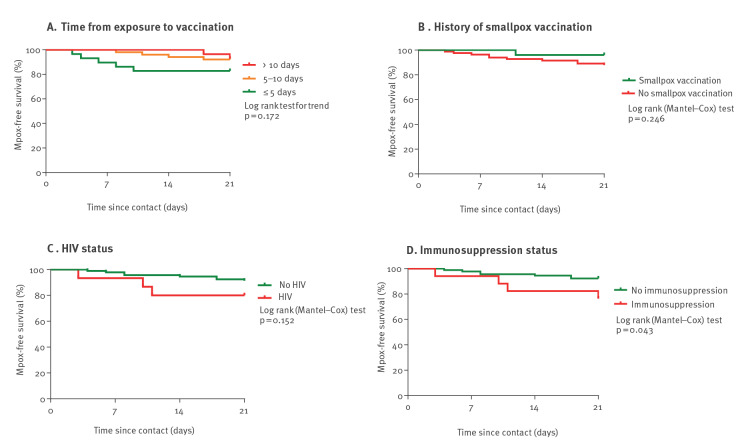
Figure 2.
Kaplan–Meier plots of the probability of remaining mpox-free in the 21 days following exposure, according to (A) time from exposure to vaccination, (B) history of smallpox vaccination, (C) HIV and (D) immunosuppression status, Lyon, France, June–August 2022 (n = 108 contacts vaccinated post-exposure)
All graphs represent Kaplan–Meier plots, which are a visual representation of the so-called ‘survival’ function. The y-axes represent the ‘survival’ probability (i.e. probability of remaining free of mpox) for contacts of mpox cases, and the x-axes represent the time elapsed since contact occurred. The curves are plotted for different groups of contacts (depending on when these groups were vaccinated against mpox, if they had prior received smallpox vaccination in their lives etc.). Groups are compared using the log-rank (Mantel–Cox) test.

