. 2022 Dec 20;11(1):72–92. doi: 10.1158/2326-6066.CIR-21-1088

Figure 1.

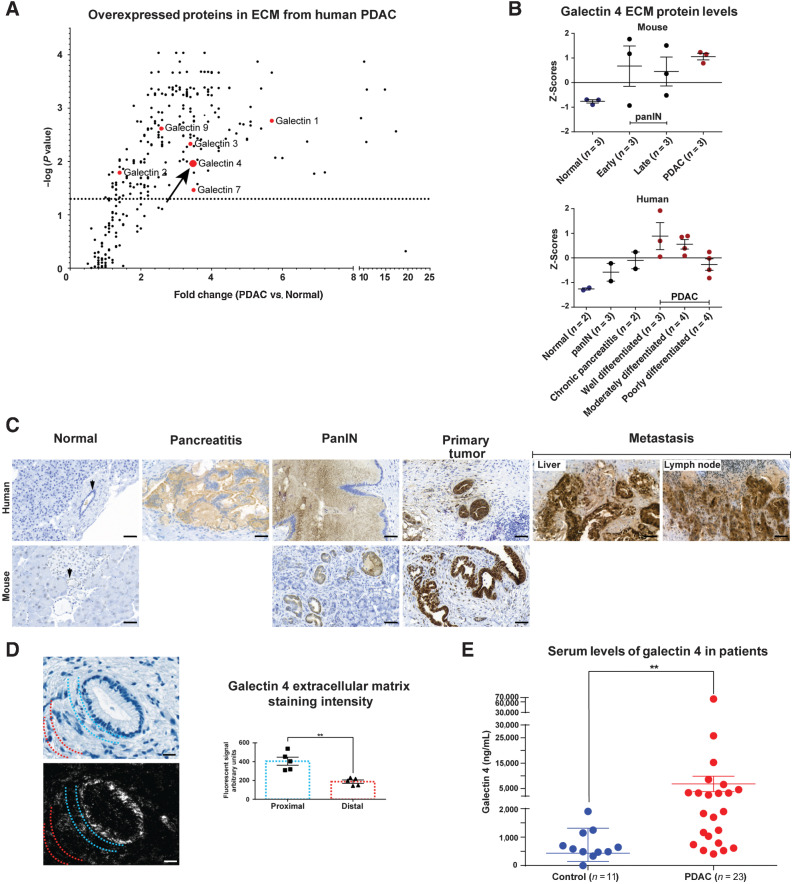
Figure 1. High levels of galectin 4 in pancreatic tumors and in the circulation of patients with pancreatic cancer. A, Volcano plot illustrating fold-change in extracellular expression of proteins detected from quantitative mass spectrometry performed on purified ECM from human PDAC tumors and normal pancreatic tissue (data from; ref. 22). Detected members of the galectin family of proteins in red. Arrow denotes galectin 4. Dotted horizontal line indicate significance level P = 0.05 (n = 5 tumors, n = 2 normal pancreatic tissue). B, Mass spectrometry Z scores for galectin 4 (data from; ref. 22) in mouse and human tissue from normal pancreas, PanIN, chronic pancreatitis, and tumor samples (subcategorized by early- and late-stage for mouse samples). Error bars indicate mean±SEM of Z-scores. C, Representative IHC staining of galectin 4 in murine and human normal pancreatic tissue, human pancreatitis, murine and human PanIN precursor lesions, KPC-derived murine cancer and well-differentiated human PDAC, and human liver and lymph node metastases. Arrows denote normal pancreatic ducts. 5 samples from each tissue condition were stained; scale bar, 50 μm. D, PDAC tumors counterstained with HTX (top left) and labeled with UCNPs (bottom left) on the same section. Semiquantitative analysis of gal 4 signal intensity in areas proximal to or distal from the epithelial cells (right). The UCNP emission was quantified in areas proximal to epithelial cells (blue dotted lines represent the area where the luminescent signal was quantified) or distal from tumors (red dotted lines represent the area where the luminescent signal was quantified) in 5 tumors; scale bar, 20 μm. E, ELISAs to detect serum galectin 4 protein in patients with PDAC (red) and aged-matched controls (blue). Significance calculated using the Mann–Whitney test (P = 0.0012). Error bars show mean±SEM.

High levels of galectin 4 in pancreatic tumors and in the circulation of patients with pancreatic cancer. A, Volcano plot illustrating fold-change in extracellular expression of proteins detected from quantitative mass spectrometry performed on purified ECM from human PDAC tumors and normal pancreatic tissue (data from; ref. 22). Detected members of the galectin family of proteins in red. Arrow denotes galectin 4. Dotted horizontal line indicate significance level P = 0.05 (n = 5 tumors, n = 2 normal pancreatic tissue). B, Mass spectrometry Z scores for galectin 4 (data from; ref. 22) in mouse and human tissue from normal pancreas, PanIN, chronic pancreatitis, and tumor samples (subcategorized by early- and late-stage for mouse samples). Error bars indicate mean ± SEM of Z-scores. C, Representative IHC staining of gal 4 in murine and human normal pancreatic tissue, human pancreatitis, murine and human PanIN precursor lesions, KPC-derived murine cancer and well-differentiated human PDAC, and human liver and lymph node metastases. Arrows denote normal pancreatic ducts. 5 samples from each tissue condition were stained; scale bar, 50 μm. D, PDAC tumors counterstained with HTX (top left) and labeled with UCNPs (bottom left) on the same section. Semiquantitative analysis of gal 4 signal intensity in areas proximal to or distal from the epithelial cells (right). The UCNP emission was quantified in areas proximal to epithelial cells (blue dotted lines represent the area where the luminescent signal was quantified) or distal from tumors (red dotted lines represent the area where the luminescent signal was quantified) in 5 tumors; scale bar, 20 μm. E, ELISAs to detect serum galectin 4 protein in patients with PDAC (red) and aged-matched controls (blue). Significance calculated using the Mann–Whitney test (P = 0.0012). Error bars show mean ± SEM. **, P < 0.01.