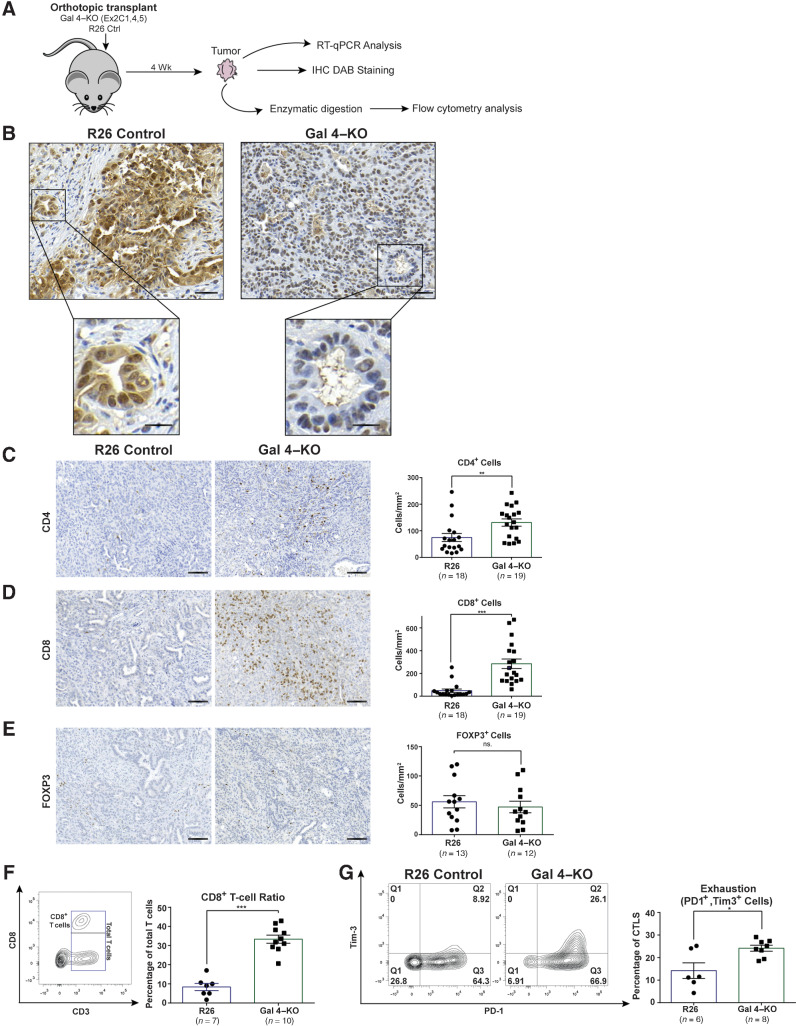
Figure 3.
Orthotopic transplantation of gal 4–KO cell lines identifies differences in CD4+ and CD8+ cell infiltration and function. A, Schematic of the orthotopic transplantation experiments using gal 4–KO and R26 control cell lines transplanted into immune competent C57BL6/J mice. B, Representative IHC images of gal 4 in R26 control and gal 4–KO tumors (top scale bar, 50 μm; bottom, scale bar, 20 μm). A total of 10 tumors were stained, 5 of each condition. C–E, Representative IHC images (left) and quantification (right) of CD4+ cells (P = 0.0032; C), CD8+ cells (P = <0.0001; D), and FOXP3+ cells (ns., no significant difference; E), in orthotopically transplanted tumors with gal 4 (R26 controls) and no gal 4 expression (Gal 4–KO); scale bar, 100 μm. Significance calculated using the Mann–Whitney test. Error bars show mean ± SEM. F, Representative contour plots illustrating gating strategies of intratumoral CD8+ T cells (left). Scatter plot with bar graph showing the fraction of CD8+ cells out of the total amount of CD45+ CD3+ cells in R26 control and gal 4–KO tumors (right; P = 0.0001). Significance calculated using the Mann–Whitney test. Error bars show mean±SEM. G Representative contour plots of intratumoral CD45+, CD3+, CD8+ cells (CD8+ T cells gated as in Fig. 3 F) expressing the exhaustion markers PD-1 (x-axis) and Tim-3 (y-axis) in R26 control and gal 4–KO tumors (left). Scatter plot with bar graph s (right) showing quantification of CD8+ T cells exhaustion (PD1+ and Tim-3 cells in Q2) in R26 control and gal 4–KO tumors (P = 0.046). Significance calculated using the Mann–Whitney test. Error bars show mean with SEM. **, P < 0.01; ***, P < 0.001.

