Figure 5.
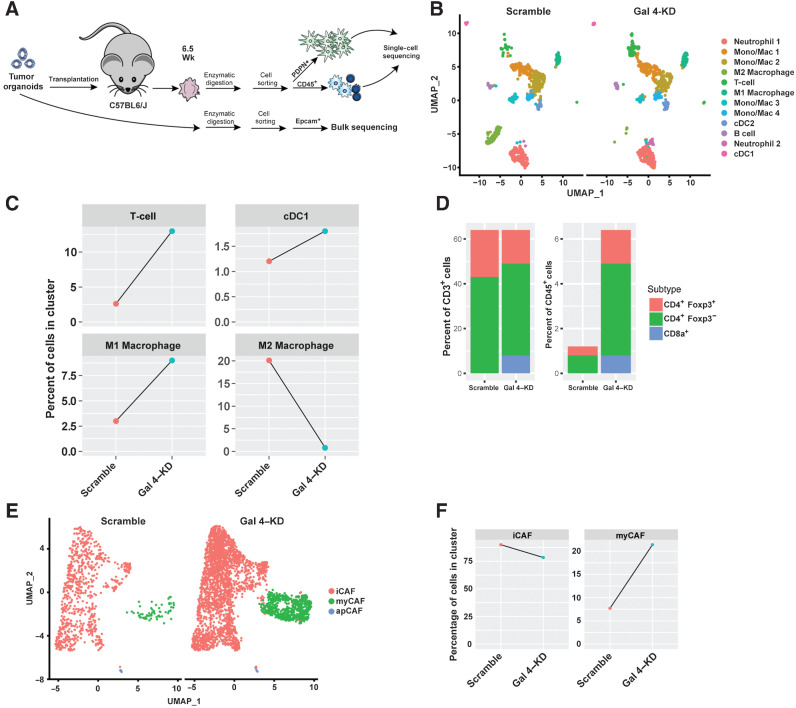
Single-cell RNA-seq of scramble-control and gal 4–KD orthotopic transplants, with a focus on immune cell subpopulations and CAF subtypes. A, Schematic of orthotopic transplantation of gal 4–KD and scramble-control organoid lines into C57BL6/J mice. 4 tumors were harvested at 6.5 weeks, followed by dissociation, cell sorting of podoplanin+ and CD45+ cells and 2 were selected for 10x single-cell sequencing based on the sample quality. A total of 7,677 cells were analyzed. Epcam+ cells from gal 4–KD and scramble-control organoid lines bulk-sequenced using Smart-Seq2. B, Uniform Manifold Approximation and Projection (UMAP) plot showing all detected immune cell (CD45+) populations from single-cell sequencing of scramble-control and gal 4–KD tumors in orthotopic transplants. Mac, macrophage; Mono, monocytes; cDC, conventional DC subsets. C, Line graph showing differences in the percentage of cells in clusters of T cells, M1 macrophages, M2 macrophages, and DCs between scramble-control and gal 4–KD orthotopic transplants. D, Bar graph showing differences in ratio of CD8a+, CD4+Foxp3−, and CD4+FOXP3+ cells in all CD3+ cells or all CD45+ cells. E, UMAP plot showing all detected CAF populations from single-cell sequencing of scramble-control and gal 4–KD tumors in orthotopic transplants. F, Line graph showing differences in the percentage of cells in clusters of iCAFs and myCAFs between scramble-control and gal 4–KD orthotopic transplants.

