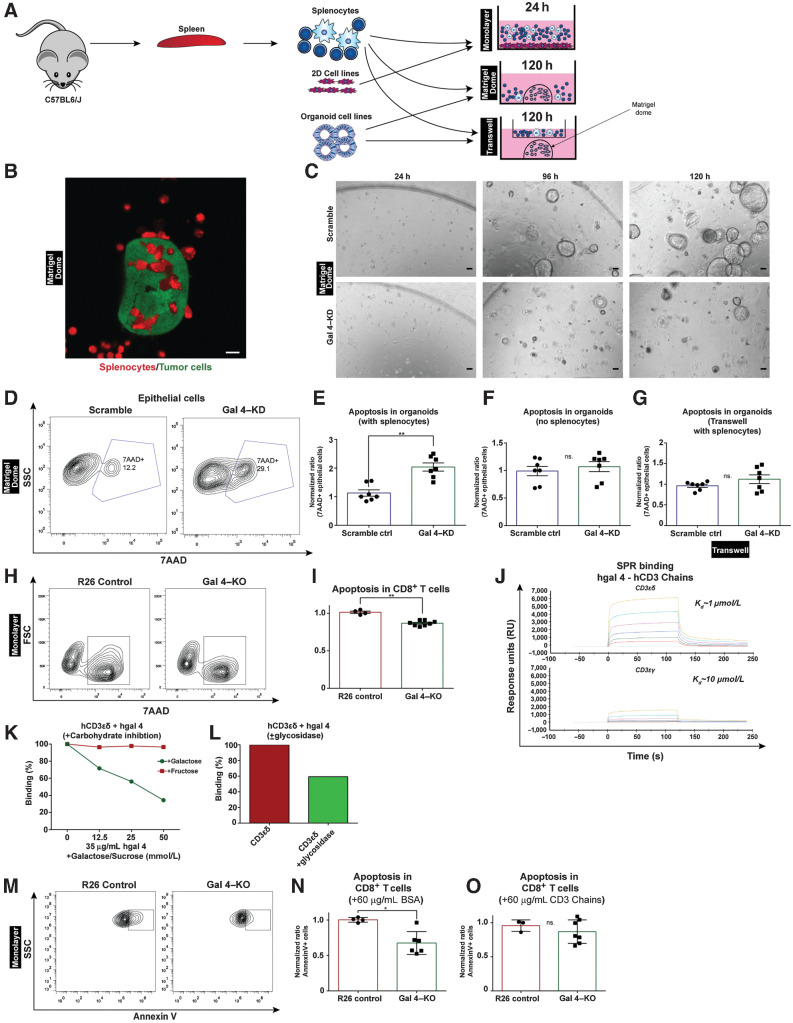
Figure 6.
Ex vivo models of PDAC reveal immunosuppressive effects of galectin 4 through CD3δ. A, Schematic depicting two ex vivo model systems using splenocytes isolated from immunocompetent C57BL6/J mice added to KPC-derived 2D cells (Monolayer model) or tumor organoids/tumor spheroids (Matrigel dome and Transwell models). Splenocytes were isolated from aged-matched C57BL6/J mice. B, Representative confocal microscope image of a KPC cell–derived spheroid (GPF, green) surrounded by T cells (cell tracker deep red stain, red) after 48 hours of incubation; scale bar, 10 μm. C, Representative brightfield images of gal 4–KD and scramble-hairpin control organoids at 24, 96, and 120 hours in cocultures with immune cells (scale bar, 100 μm). The experiment was repeated 3 times. D, Representative contour plot showing gating strategy for 7AAD+ epithelial cells from dissociated Matrigel domes in scramble-hairpin controls and gal 4–KD cell lines in the tumor organoid ex vivo model. Quantifications from this experiment are presented in E–G. E–G, Scatter plot with bar graph showing flow cytometry quantification of apoptosis in organoid cells from dissociated Matrigel domes with added splenocytes (E), without splenocytes (organoids only; F), organoids with splenocytes in Transwell at 120 hours timepoint (G). Scramble-hairpin controls (n = 6) and gal 4–KD (n = 7); ns., not significant. H, Representative contour plots showing gating strategy for 7AAD+CD8+ T cells from the monolayer model using R26 control and gal 4–KO cell lines. Quantifications from this experiment are presented in I. I, Scatter plot with bar graph showing flow cytometry quantification of 7AAD+CD8+ T cells added to R26 control (n = 4) and gal 4–KO (n = 8) in the monolayer model (R26 normalized to 1) at 24 hours in culture. Significance (**, P = 0.004) calculated using the Mann–Whitney test. J, SPR binding graph showing binding between human recombinant gal 4 (hgal 4) and human recombinant CD3ε/δ and CD3ε/γ heterodimer chains. The experiment was repeated 3 times. K, Line graph of SPR data for carbohydrate inhibition of binding between human recombinant gal 4 and human recombinant CD3ε/δ heterodimer treated with either galactose or fructose. The experiment was repeated once for fructose and twice for galactose. L, Bar graph of SPR data for binding between human recombinant gal 4 and human recombinant CD3ε/δ heterodimer following treatment with a glycosidase targeting N-linked glycosylations. The experiment was repeated 2 times. M, Representative contour plot showing gating strategy for AnnexinV+CD8+ T cells from monolayer model used in the gal 4-blocking assay. Quantifications from this experiment are presented in N–O. N, Scatter plot with bar graph showing flow cytometry quantification of AnnexinV+CD8+ T cells added to R26 control (n = 4) and gal 4–KO (n = 6) supplemented with BSA in the monolayer model (R26 normalized to 1). Significance (P = 0.019) calculated using the Mann–Whitney test. O, Scatter plot with bar graph showing flow cytometry quantification of AnnexinV+ CD8+ T cells added to R26 control (n = 3) and gal 4–KO (n = 7) supplemented with 60 μg/mL soluble CD3 chains in the 2D cell-based ex vivo model (R26 normalized to 1). Non-significant, ns.; *, P = 0.5167 calculated using the Mann–Whitney test.

