. 2022 Oct 10;21(1):36–50. doi: 10.1158/1541-7786.MCR-22-0163

Figure 1.

Figure 1. Low level ACO2 protein is most strongly associated with engraftment and worse survival. A, Super-SILAC quantitative proteome analysis of 52 NSCLC patient tumors. B, Spearman correlation hierarchal clustering of 52 NSCLC proteomes and including CES. C, Statistical analysis performed to identify protein expression predictive of engraftment. D, Venn-diagram of proteins selected in (C). Twelve proteins highlighted in purple predict XG from Non-XG in both LUAD and LUSC and do not interact with histology. E, Leave-one-out cross validation analysis showed that 45 of 52 samples were classified correctly based on risk scores. F, The 12 metabolism signature proteins that are predictive of engraftment. G, Volcano plot showing the significantly differential proteins between XG and Non-XG (Welch t test permutation-based FDR < 0.05). H, Enriched pathways by 194 significantly differential proteins between XG and Non-XG using IPA. Pathways shown in boldface/purple bars include ACO2. H, OS of low versus high ACO2 expressing tumors in an independent LUAD patient cohort based on TMA. I, DFS of low versus high ACO2 expressing tumors in an independent LUAD patient cohort based on TMA. J, OS of low vs. medium versus high ACO2 expressing tumors in an independent LUSC patient cohort based on TMA (see also Supplementary Fig. S1A–C). K, DFS of low versus medium versus high ACO2 expressing tumors in an independent LUSC patient cohort based on TMA (see also Supplementary Fig. S1A–S1C).

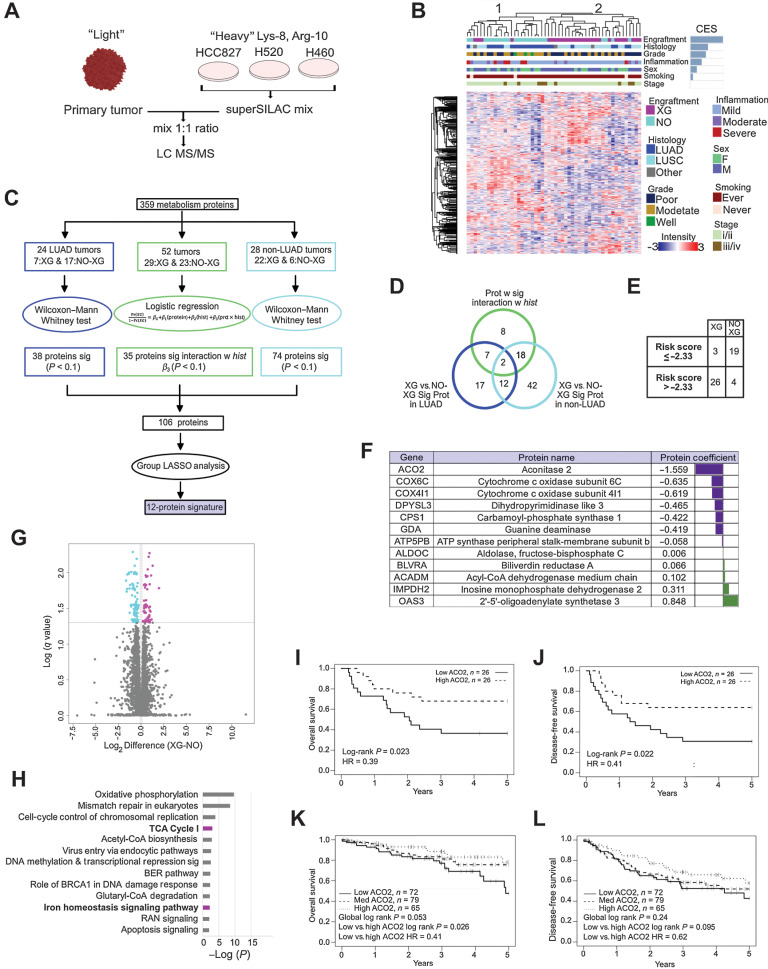
Low level ACO2 protein is most strongly associated with engraftment and worse survival. A, Super-SILAC quantitative proteome analysis of 52 NSCLC patient tumors. B, Spearman correlation hierarchal clustering of 52 NSCLC proteomes and including CES. C, Statistical analysis performed to identify protein expression predictive of engraftment. D, Venn-diagram of proteins selected in (C). Twelve proteins highlighted in purple predict XG from Non-XG in both LUAD and LUSC and do not interact with histology. E, Leave-one-out cross validation analysis showed that 45 of 52 samples were classified correctly based on risk scores. F, The 12 metabolism signature proteins that are predictive of engraftment. G, Volcano plot showing the significantly differential proteins between XG and Non-XG (Welch t test permutation-based FDR < 0.05). H, Enriched pathways by 194 significantly differential proteins between XG and Non-XG using IPA. Pathways shown in boldface/purple bars include ACO2. H, OS of low versus high ACO2 expressing tumors in an independent LUAD patient cohort based on TMA. I, DFS of low versus high ACO2 expressing tumors in an independent LUAD patient cohort based on TMA. J, OS of low vs. medium versus high ACO2 expressing tumors in an independent LUSC patient cohort based on TMA (see also Supplementary Fig. S1A–C). K and L, DFS of low versus medium versus high ACO2 expressing tumors in an independent LUSC patient cohort based on TMA (see also Supplementary Fig. S1A–S1C).