Figure 2.
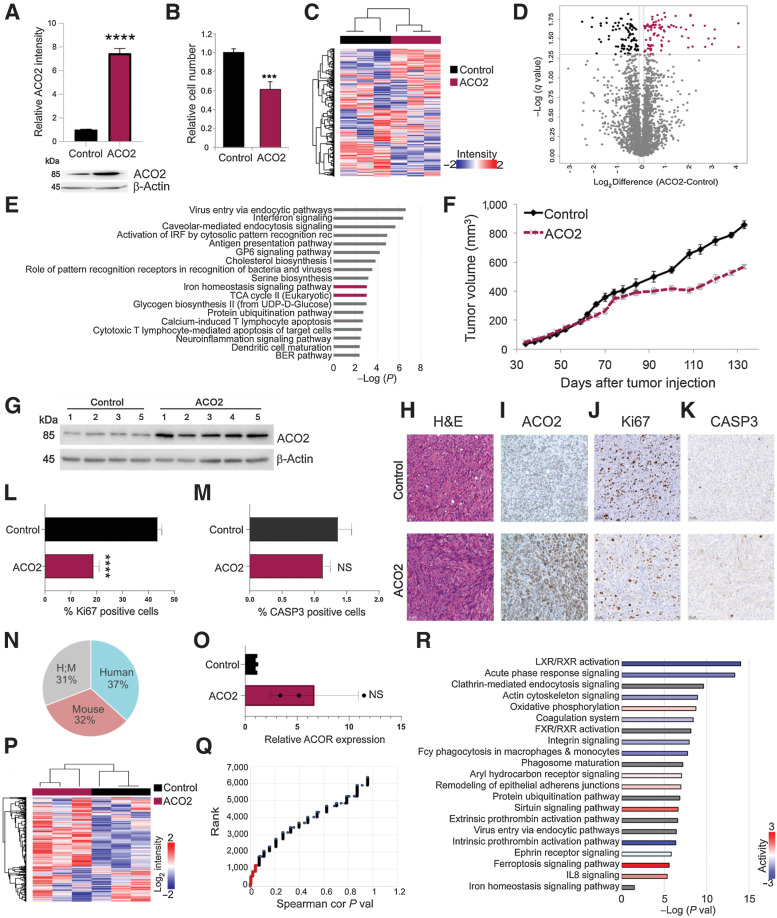
Elevated ACO2 decreases proliferation in H226 cell line in vitro and in vivo. A, Top, relative ACO2 levels in H226 cell lines between control and elevated ACO2 (mean±SD). Bottom, Western blot showing ACO2 levels in H226 cell line between control and elevated ACO2. B, Proliferation rate determined by cell number of inducible H226 NSCLC cell line between control and elevated ACO2 (mean±SD). C, Spearman hierarchal correlation of 3 control and 3 elevated ACO2 replicates of H226. D, Volcano plot showing 183 significantly differential proteins between control and elevated ACO2 (Student t test permutation-based FDR < 0.05). E, Significantly enriched pathways by IPA matched with XG versus Non-XG; ACO2-containing pathways are shown in boldface/purple bars. F, ACO2 expression reduces tumor growth in H226 NSCLC xenograft in NOD-SCID mice (mean±SD). G, Western blot showing resected H226 xenograft tumors ACO2 levels of control versus elevated ACO2. Resected H226 xenograft control versus elevated ACO2 tumors for: G, ACO2 levels via Western blotting; H, H&E staining; I, ACO2 levels via IHC; J, Ki67 as a marker of proliferation via IHC. K, CASP3 as a marker of apoptosis via IHC. L, Quantification of Ki67 positive cells show a significant decrease in number of proliferative cells (mean±SD). M, Quantification of CASP3 positive cells show no difference in number of cells undergoing apoptosis (mean±SD). N, Percentage composition of Human, Mouse, and ambiguous Human/Mouse proteins in total proteomics of H226 xenograft tumors. O, ACO2 levels of control versus elevated ACO2 H226 xenografts quantitated by MS (mean±SD). P, Spearman's correlation hierarchal clustering of 3 control and 3 elevated ACO2 H226 xenografts proteome (Q) Spearman's correlation of each protein with ACO2 are ranked based on P value with P value < 0.05 shown in red that was used for IPA. R, Significantly enriched pathways by IPA. Two-sided Student t test: *, P < 0.05; **, P < 0.005; ***, P < 0.0005; ****, P < 0.00005.

