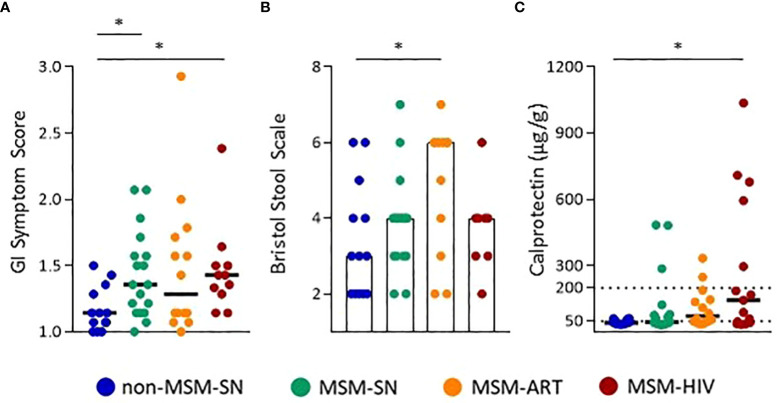
Figure 1.
Increased GI symptoms and inflammation in MSM with and without HIV infection. (A) GI Symptom Scores, and (B) Bristol Stool Scale Scores calculated from survey responses. (C) Calprotectin levels (µg/g) determined by ELISA. Each point represents data from one participant and are colored based on cohort: non-MSM-SN (dark blue), MSM-SN (green), MSM-ART (orange) and MSM-HIV (red). Black lines/hollow bars represent the median of each cohort. The dotted line at 200 µg/g represents the cutoff for clinically significant fecal calprotectin. Kruskal-Wallis tests were used to determine statistical significance with Dunn’s multiple comparisons test where * = p < 0.05, ** = p < 0.01, and *** = p < 0.001.

