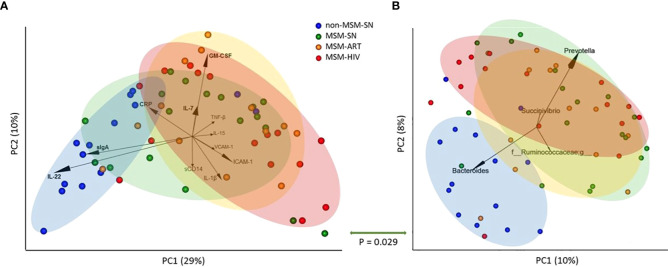
Figure 3.
Principal coordinate analyses of fecal sIF and microbiome composition segregate by MSM status. (A) PCoA plot of fecal sIF composition after normalization across samples. Each point represents one participant’s sIF composition where the distance between points is representative of relative similarity – two points closer together are more similar than two further apart. Labeled arrows of the 11 most influential sIFs on this PCoA’s distribution are included with corresponding directionality and impact as shown by the arrow’s length. (B) Unweighted UniFrac PCoA plot of fecal microbiome composition where each point represents one individual’s overall microbiome composition. Labeled arrows of the 4 most influential taxa on this PCoA’s distribution are included with corresponding directionality and impact as shown by the arrow’s length. Points are colored based on cohort: non-MSM-SN (dark blue), MSM-SN (green), MSM-ART (orange) and MSM-HIV (red). Each colored oval encircles the majority of participants in the cohort with corresponding color. The size and location were determined manually and <20% of each cohort falls outside the oval. The P value below the double-sided green arrow between plots is the result of a Mantel test that shows a significant positive correlation between these two matrices.

