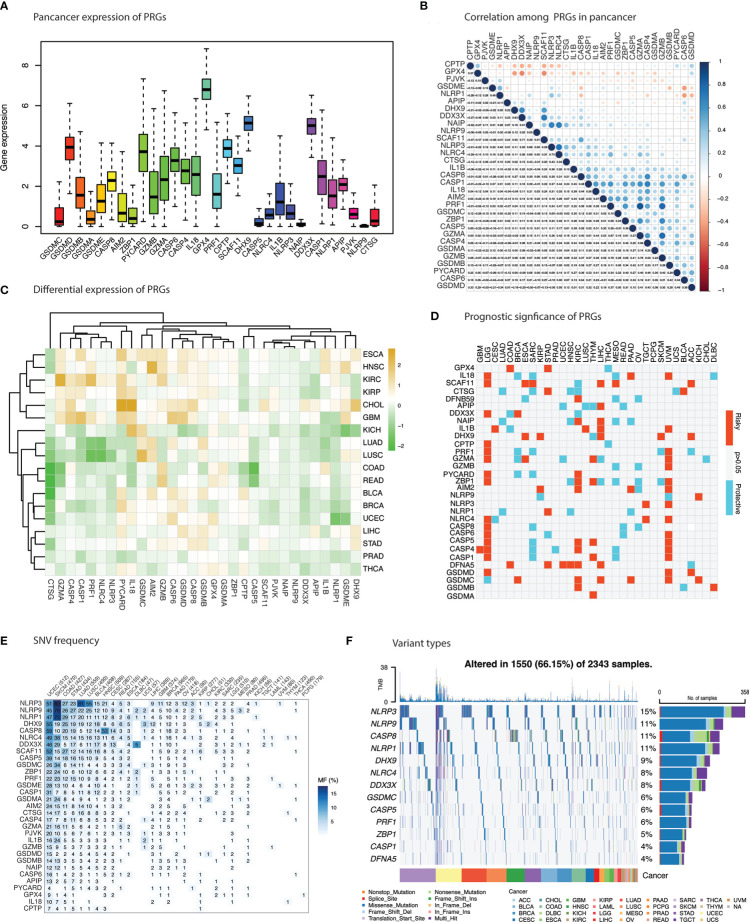
Figure 1.
Differential expression, survival risk and mutations in pyroptosis-related genes (PRGs). (A) Cumulative expression of PRGs across cancers. (B) Correlation between PRGs in cancer. Blue indicate positive correlation and red indicate negative correlation. (C) Differential expression of PRGs in 18 cancers. Brown & green represent upregulation & downregulation of PRGs in cancers respectively. (D) Survival risk of PRGs. Red and blue indicate risky and protective effect of PRGs enrichment. (E) Histogram shows the frequency of single nucleotide variation for each PRG in each cancer type. (F) Oncoplot depicting top 10 mutated PRGs in cancers.

