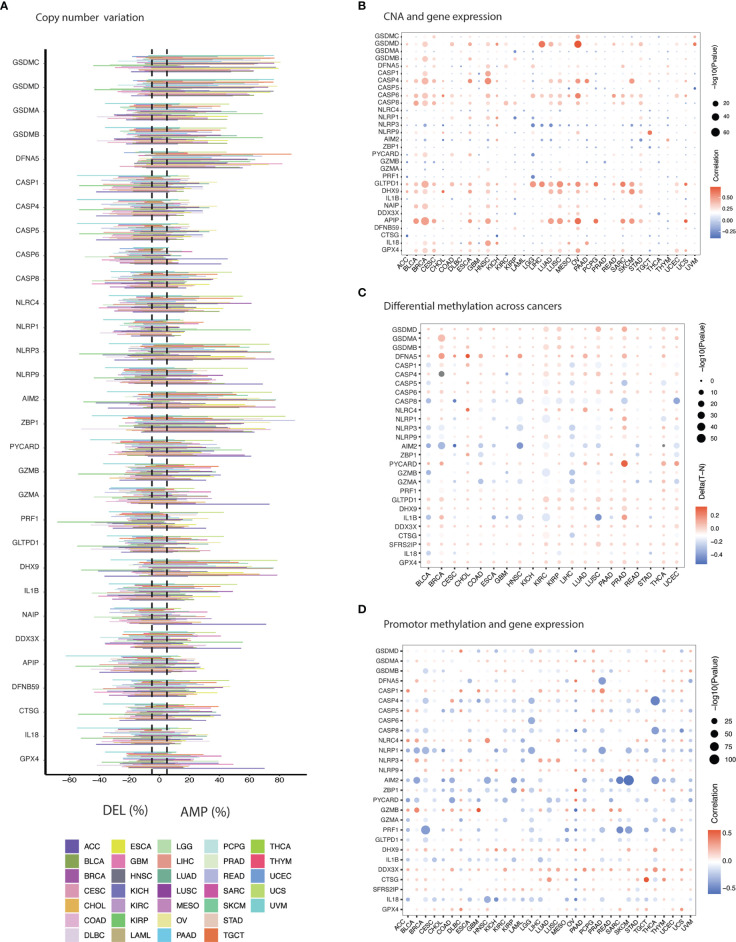
Figure 2.
Genomic & epigenetic aberrations in PRGs. (A) Histogram illustrates frequency of copy number alteration (deletion/amplification) for each PRG across cancers. (B) The Spearman’s correlation between copy number variation (CNV) and the expression of PRGs. Blue & red represent negative & positive correlation respectively. (C) Heatmap shows the methylation difference between tumor and normal tissues. Red and blue indicate hypermethylation and hypomethylation in cancers, respectively. (D) Pearson’s correlation showing association between methylation and gene expression. Blue & red represent negative & positive correlation respectively.

