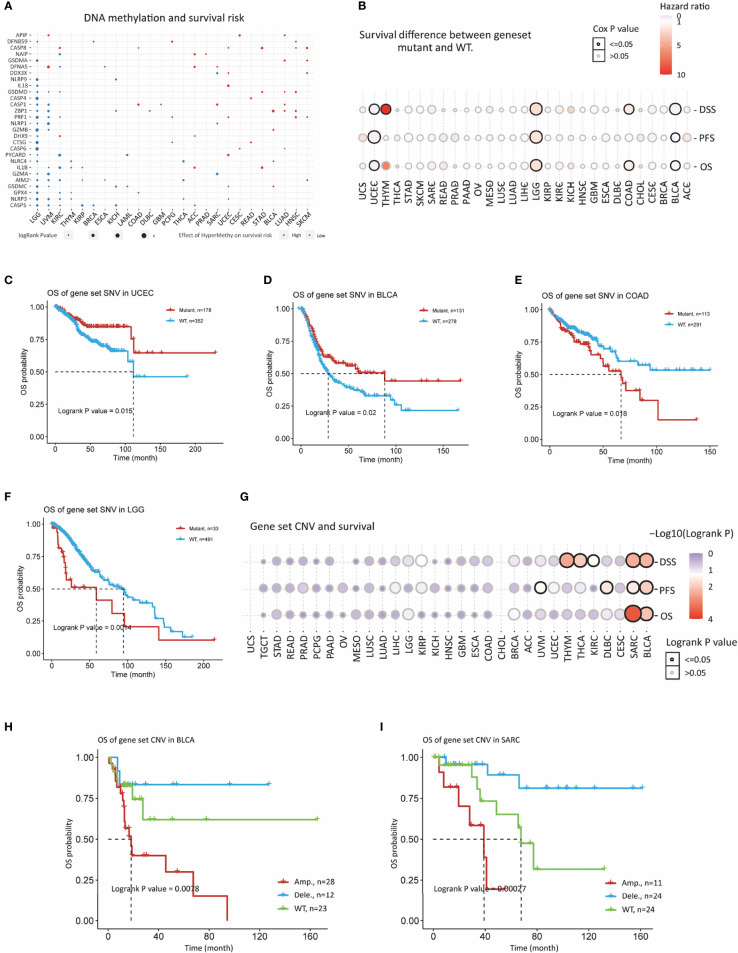
Figure 3.
Prognostic significance of genomic aberrations in PRGs. (A) Survival risk of methylation of PRGs. Red and blue indicate risky and protective effect of PRGs methylation. (B) Bubble plot depicts survival difference between SNV mutant and WT groups in cancers. (C) Kaplan-Meier curves shows survival difference between SNV mutant and WT groups in UCEC, (D) BLCA, (E) COAD, and (F) LGG (G) Bubble plot depicts survival difference between CNV Amp, Del, and WT in cancers. (H) Kaplan-Meier curves survival difference between CNV Amp, Del, and WT in BLCA and (I) SARC.

