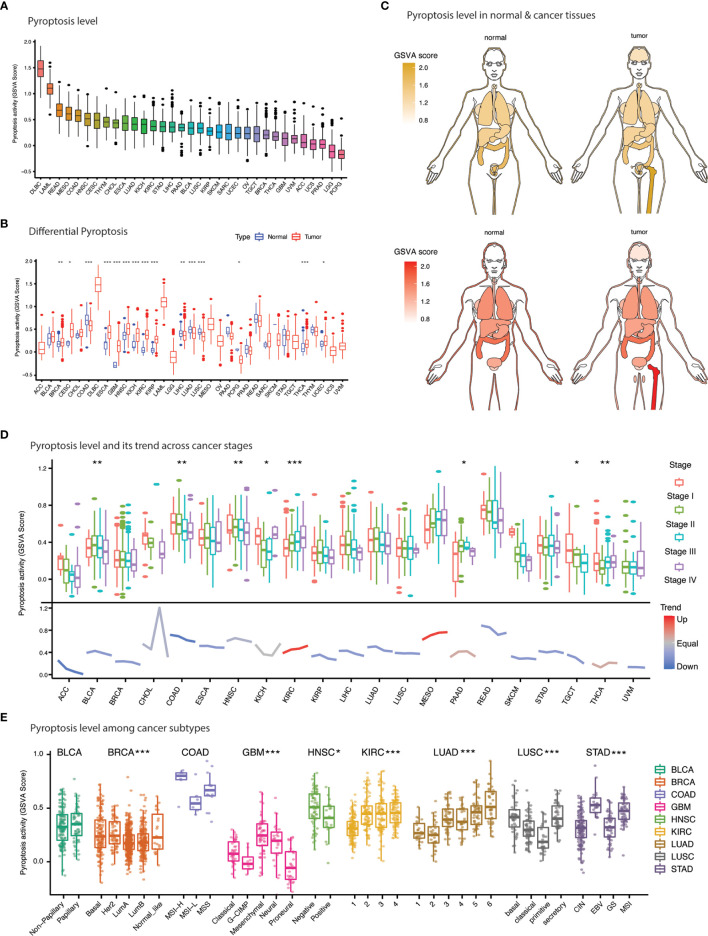
Figure 4.
Pyroptosis level and clinical features. (A) Anatogram depicting the differential pyroptosis level (GSVA score) between normal (left) and cancer (right) tissues. Yellow and red represent pyroptosis level in female and males. (B) Bar plot illustrates the pyroptosis level (GSVA score) across cancers. (C) Comparison of pyroptosis level (GSVA score) between normal and cancer tissues across 33 cancers. (D) Pyroptosis level and its tendency with cancer stages. (E) Pyroptosis level association with cancer subtypes. * p value < 0.05; ** p value < 0.01; *** p value < 0.001.

