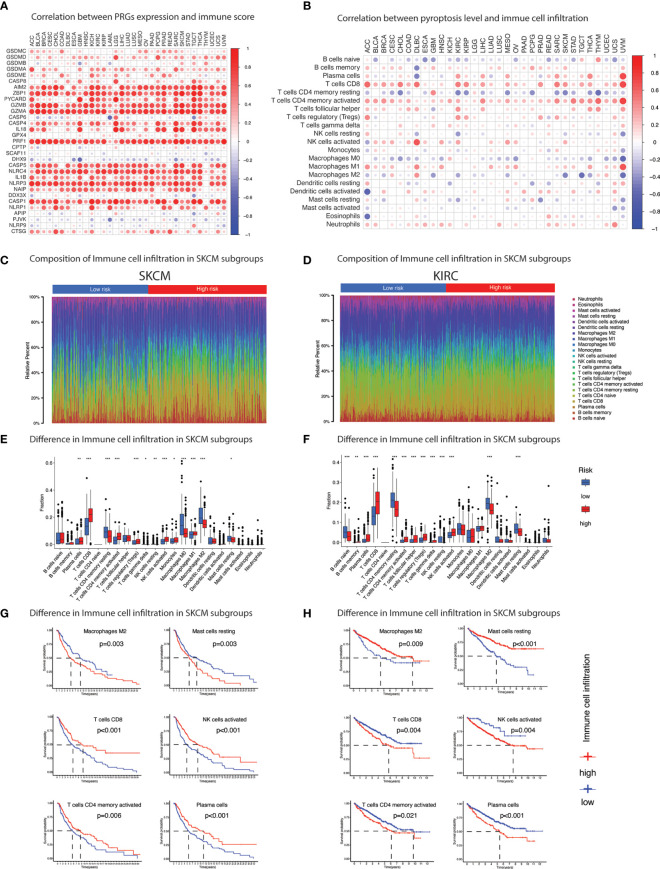
Figure 6.
Immune cell infiltration. (A) Heatmap summarizes spearman correlation between pyroptosis level and ESTIMATE immune score. Red & blue indicate positive & negative correlation. (B) Heatmap summarizes spearman correlation between pyroptosis level and infiltration of 22 types of immune cells estimated by CIBERSORT algorithm. Red & blue indicate positive & negative correlation. (C-F) Pyroptosis subgroups (pyroptosis-low and pyroptosis-high) based on median pyroptosis level & proportions of TME cells in SKCM (C & E) and KIRC (D & F). The thick lines represent the median value. The bottom and top of the boxes are the 25th and 75th percentiles (interquartile range), respectively. Significant statistical differences between the two subgroups were assessed using the Wilcoxon test. * p value < 0.05; ** p value < 0.01; *** p value < 0.001; (p value > 0.05). (G) Kaplan-Meier curves of survival analysis of immune cells in SKCM and (H) KIRC based on the infiltration level.

