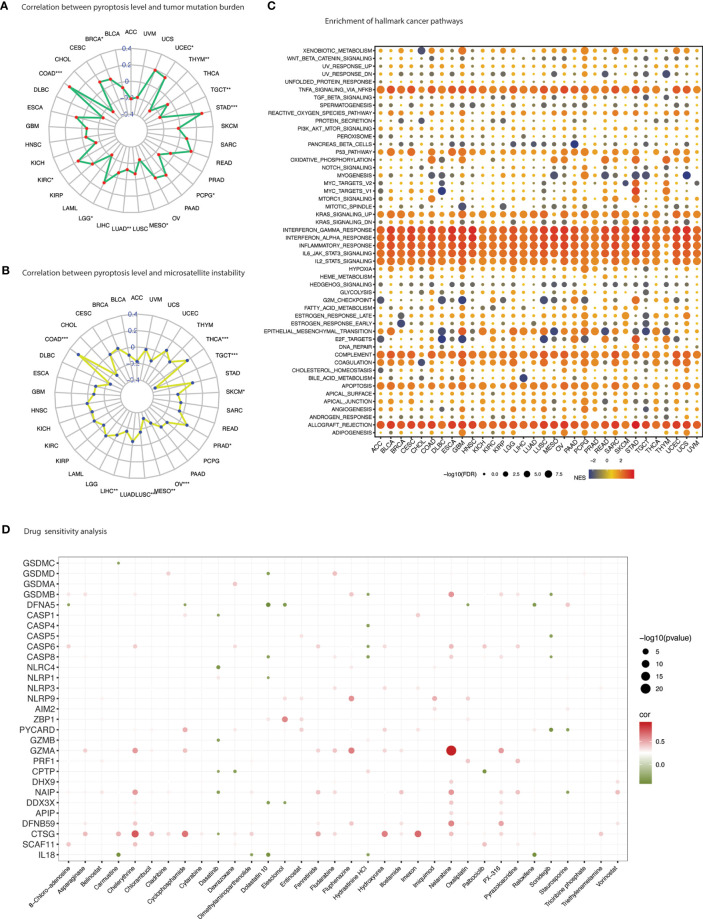
Figure 7.
Therapeutic vulnerabilities. (A) Spider web plot summarizes spearman correlation between pyroptosis level and tumor mutation burden. * p value < 0.05; ** p value < 0.01; *** p value < 0.001. (B) Spider web plot summarizes spearman correlation between pyroptosis level and microsatellite instability. * p value < 0.05; ** p value < 0.01; *** p value < 0.001. (C) Enrichment analysis for hallmark cancer pathways between pyroptosis-high and pyroptosis-low tumor tissues. NES is the normalized enrichment score in the GSEA algorithm. (D) Drug sensitivity analysis of PRGs based on the CellMiner database. Green depicts negative correlation (sensitivity to drug) and red shows positive correlation (induction of gene expression).

