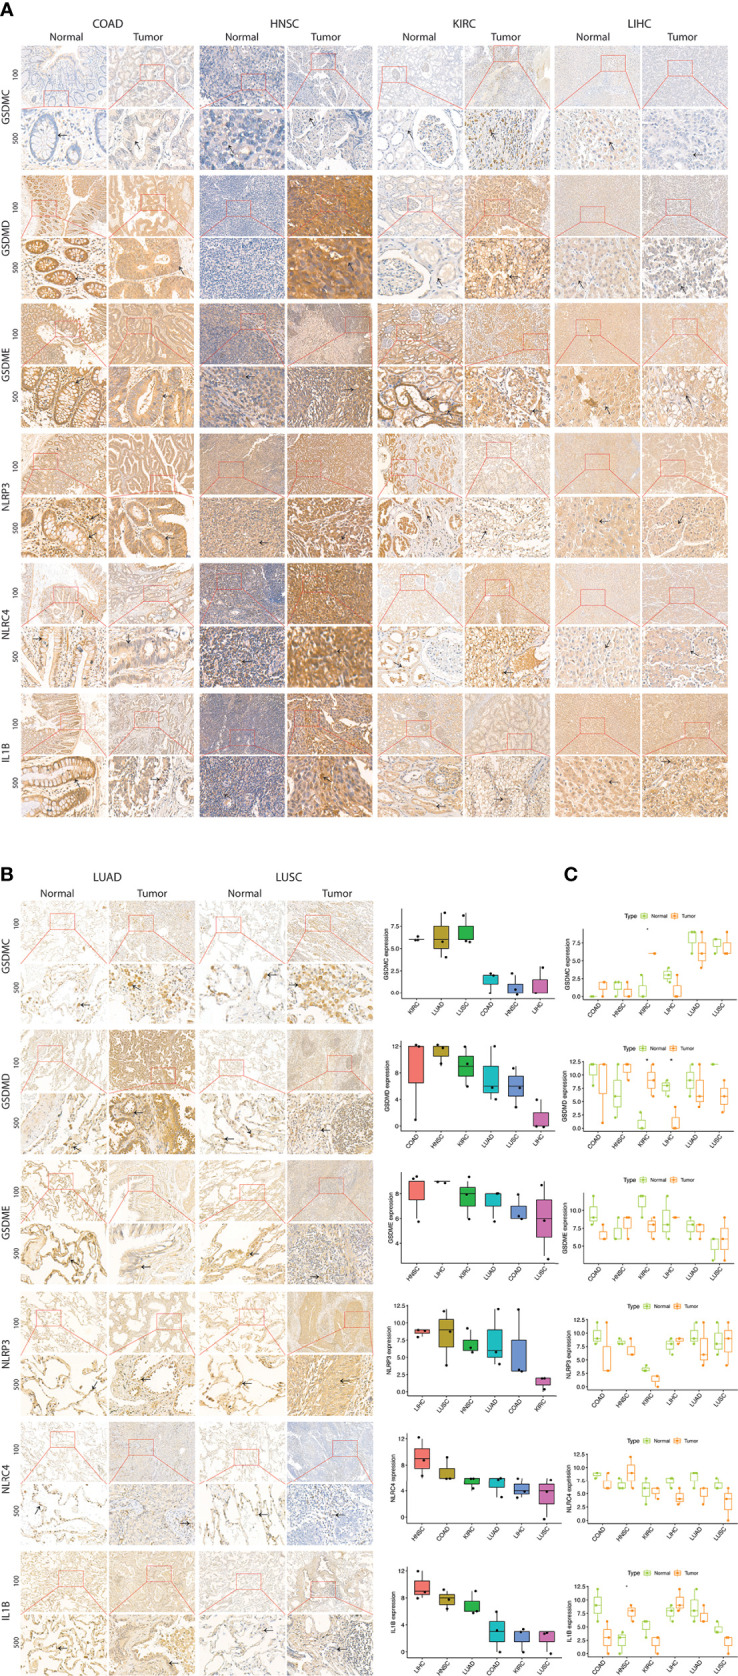
Figure 8.

Expression of selected PRGs in clinical samples. (A) Representative images of expression (brown, cell cytoplasmic/nucleus stain) of GSDMC, GSDMD, GSDME, NLRP3, NLRC4, and IL1B in the clinical samples of colon adenocarcinoma (COAD), head & neck squamous cell carcinoma (HNSC), kidney renal cell carcinoma (KIRC), liver hepatocellular carcinoma (LIHC), lung adenocarcinoma (LUAD), and lung squamous cell carcinoma (LUSC). (B) Expression level (IHC quantification) of PRGs in the clinical samples of colon adenocarcinoma (COAD), head &. Neck squamous cell carcinoma (HNSC), and kidney renal cell carcinoma (KIRC), liver hepatocellular carcinoma (LIHC), lung adenocarcinoma (LUAD), and lung squamous cell carcinoma (LUSC). (C) Differential expression (IHC quantification) of PRGs in the clinical samples of colon adenocarcinoma (COAD), head &. Neck squamous cell carcinoma (HNSC), and kidney renal cell carcinoma (KIRC), liver hepatocellular carcinoma (LIHC), lung adenocarcinoma (LUAD), and lung squamous cell carcinoma (LUSC). P values are shown as: *P<0.05; **P < 0.01; ***P < 0.001 (t-test).
