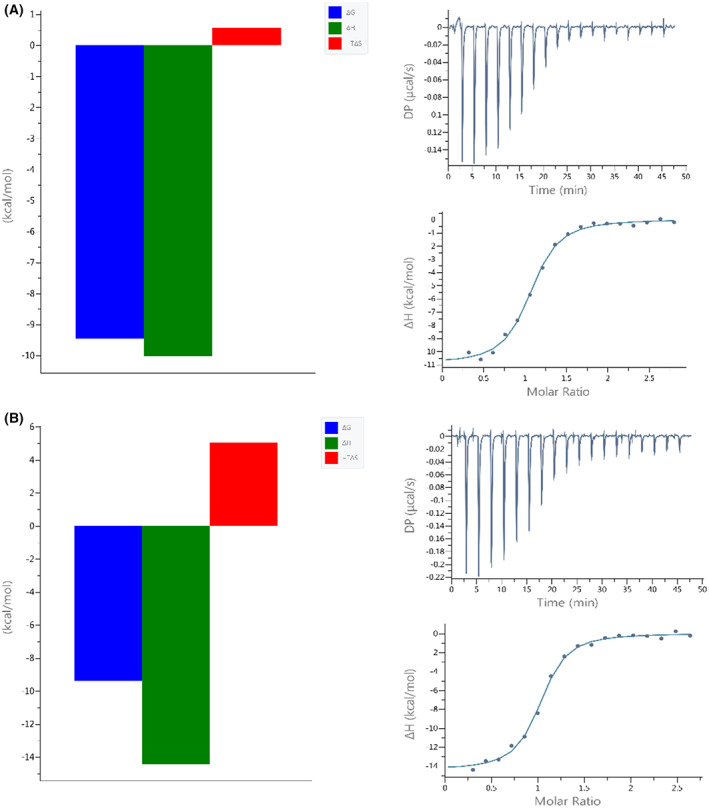
Fig. 2.

Signatures (left panels) and calorimetric titration isotherms (right panels) of binding of (A) SARS‐CoV‐1 RBD and (B) SARS‐CoV‐2 RBD to the hACE2 receptor protein under the same experimental conditions (PBS buffer, pH 7.4, 25 °C). The concentration of hACE2 was 6 μm and the concentration of the RBDs was in the range of 91–92 μm.
