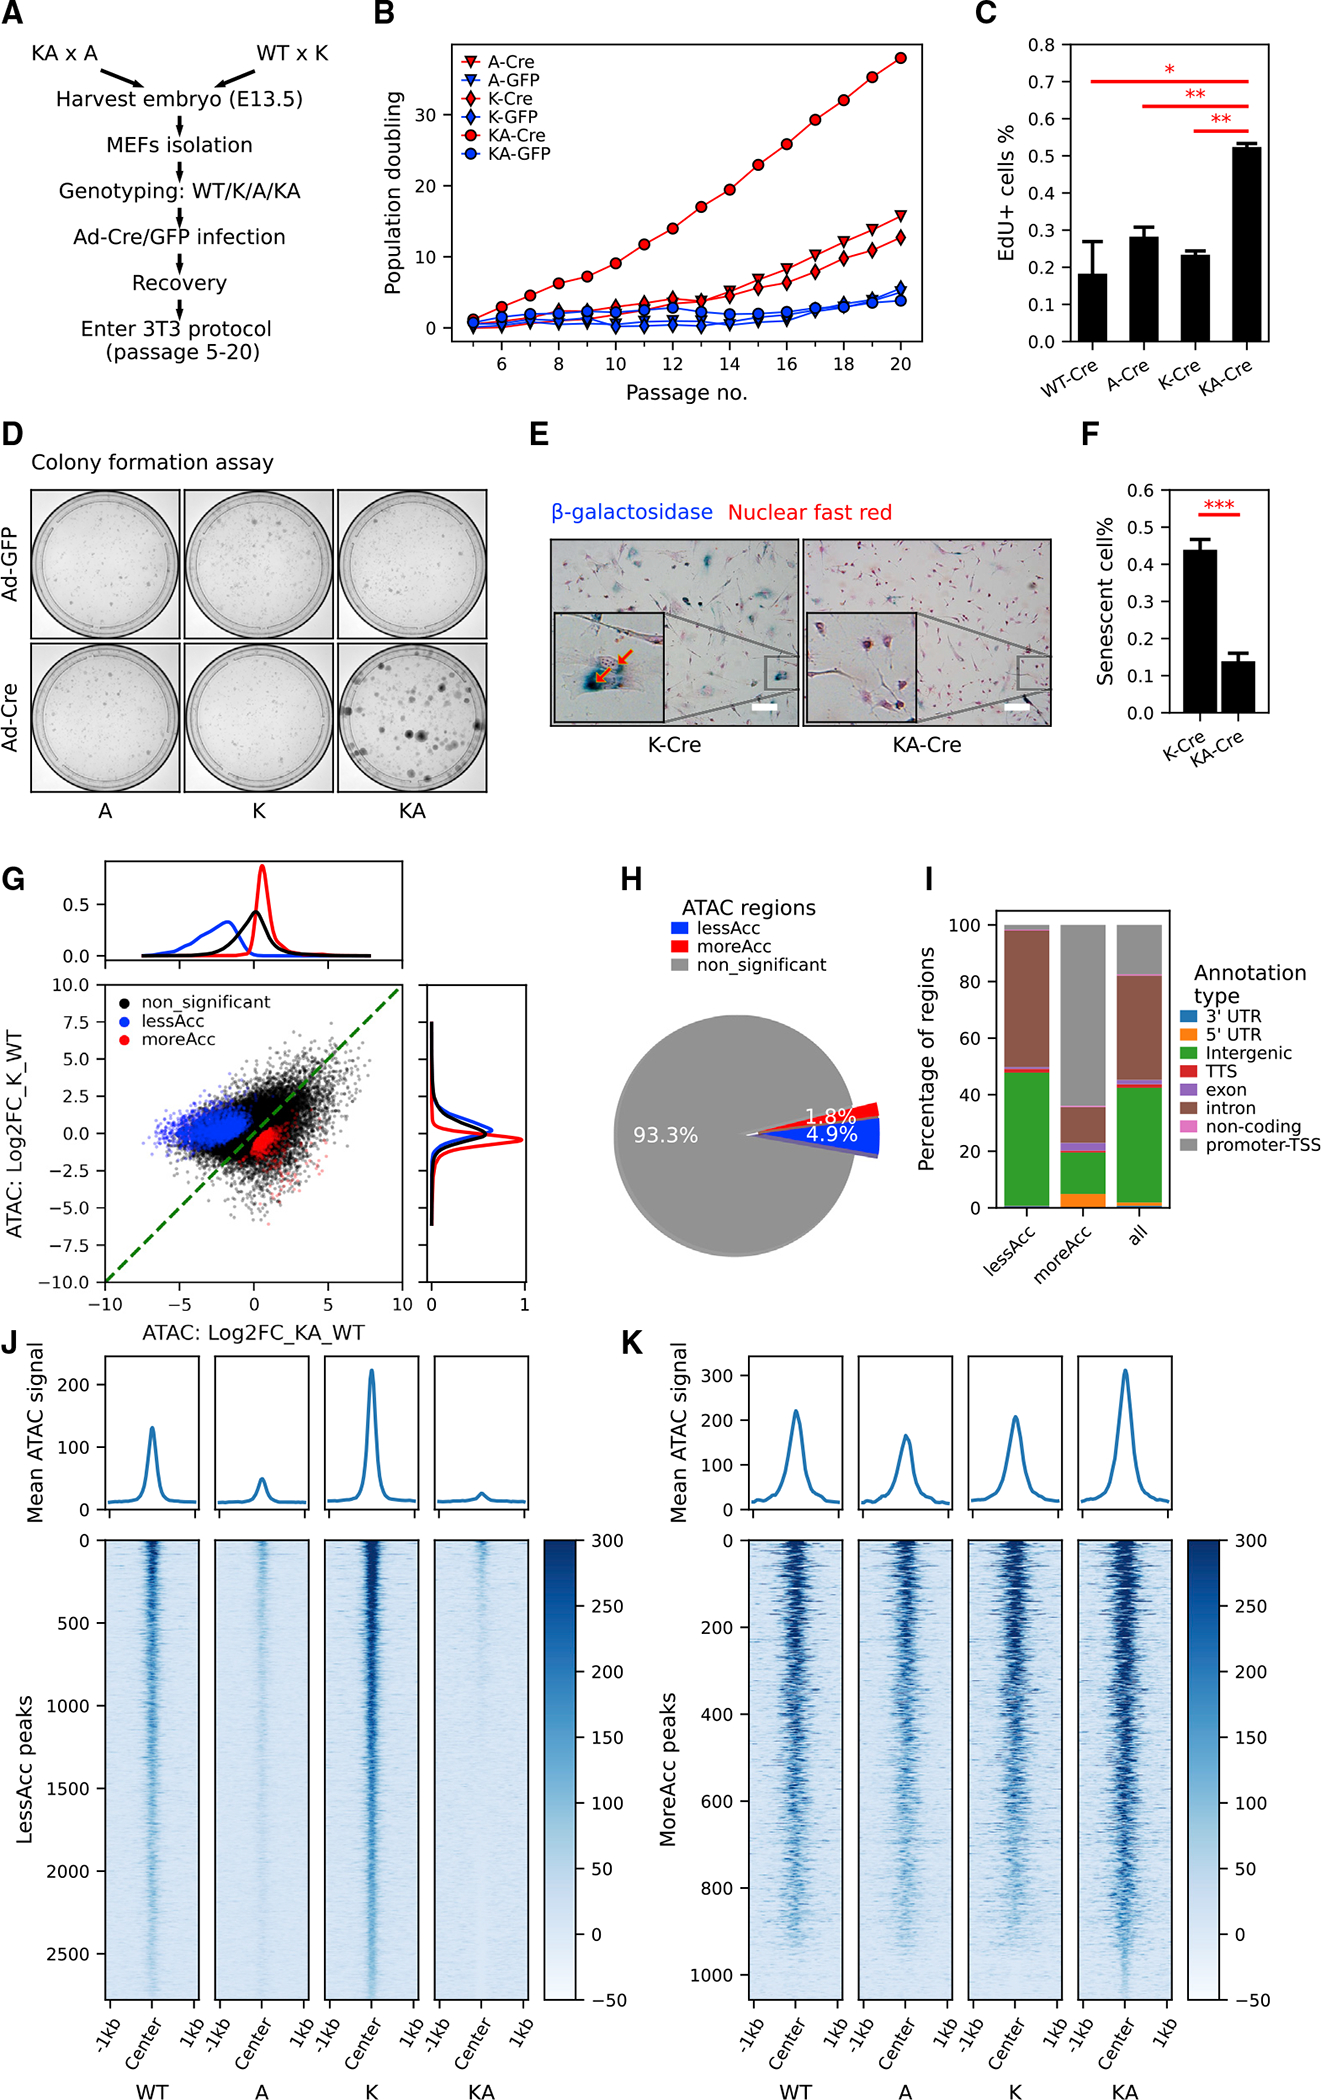
Figure 2. KrasG12D and Arid1a−/− cooperate in driving mouse embryonic fibroblast proliferation with increased chromatin accessibility in promoters and decreased chromatin accessibility in distal genomic regions.

(A) The workflow of generating MEFs with KrasG12D and/or Arid1a−/− for in vitro study.
(B) Population doubling curve of MEFs with no, single, or combined KrasG12D and Arid1a−/− mutations (n = 2 cell lines per genotype. Cre: recombined. GFP: unrecombined). Also see Figure S2D.
(C) Quantification of EdU incorporation of WT-Cre, A-Cre, K-Cre, and KA-Cre MEFs (n = 2 repeats from the same round of infection, Student’s t tests, *p < 0.05, **p < 0.01). See representative images in Figure S2E.
(D) Representative images of colony formation assay of MEFs with indicated genotypes (n = 3).
(E and F) Representative images (E) and quantification (F) of senescence-associated b-galactosidase staining in K-Cre and KA-Cre MEFs (n = 4, Student’s t test, ***p < 0.001). Also, see Figures S2G and S2H for b-galactosidase staining in K-Cre versus K-GFP MEFs. Scale bar, 50 μm.
(G and H) Scatterplot (G) and pie chart (H) characterizing differentially accessible regions between KA and K MEFs. Density plots of log2 fold change in chromatin accessibility in either all ATAC peaks (black), less accessible (lessAcc, blue), or more accessible (moreAcc, red) peaks are provided for the KA versus WT comparison (at top in G) and the K versus WT comparison (at right in G).
(I) Different percentages of ATAC peak annotation types between lessAcc and moreAcc peaks.
(J and K) Heatmaps showing chromatin accessibility in lessAcc (J) and moreAcc (K) regions across genotypes. For the heatmaps, ATAC counts of all 3 samples per genotype were merged. Plots on the top show the average ATAC-signal across regions.
