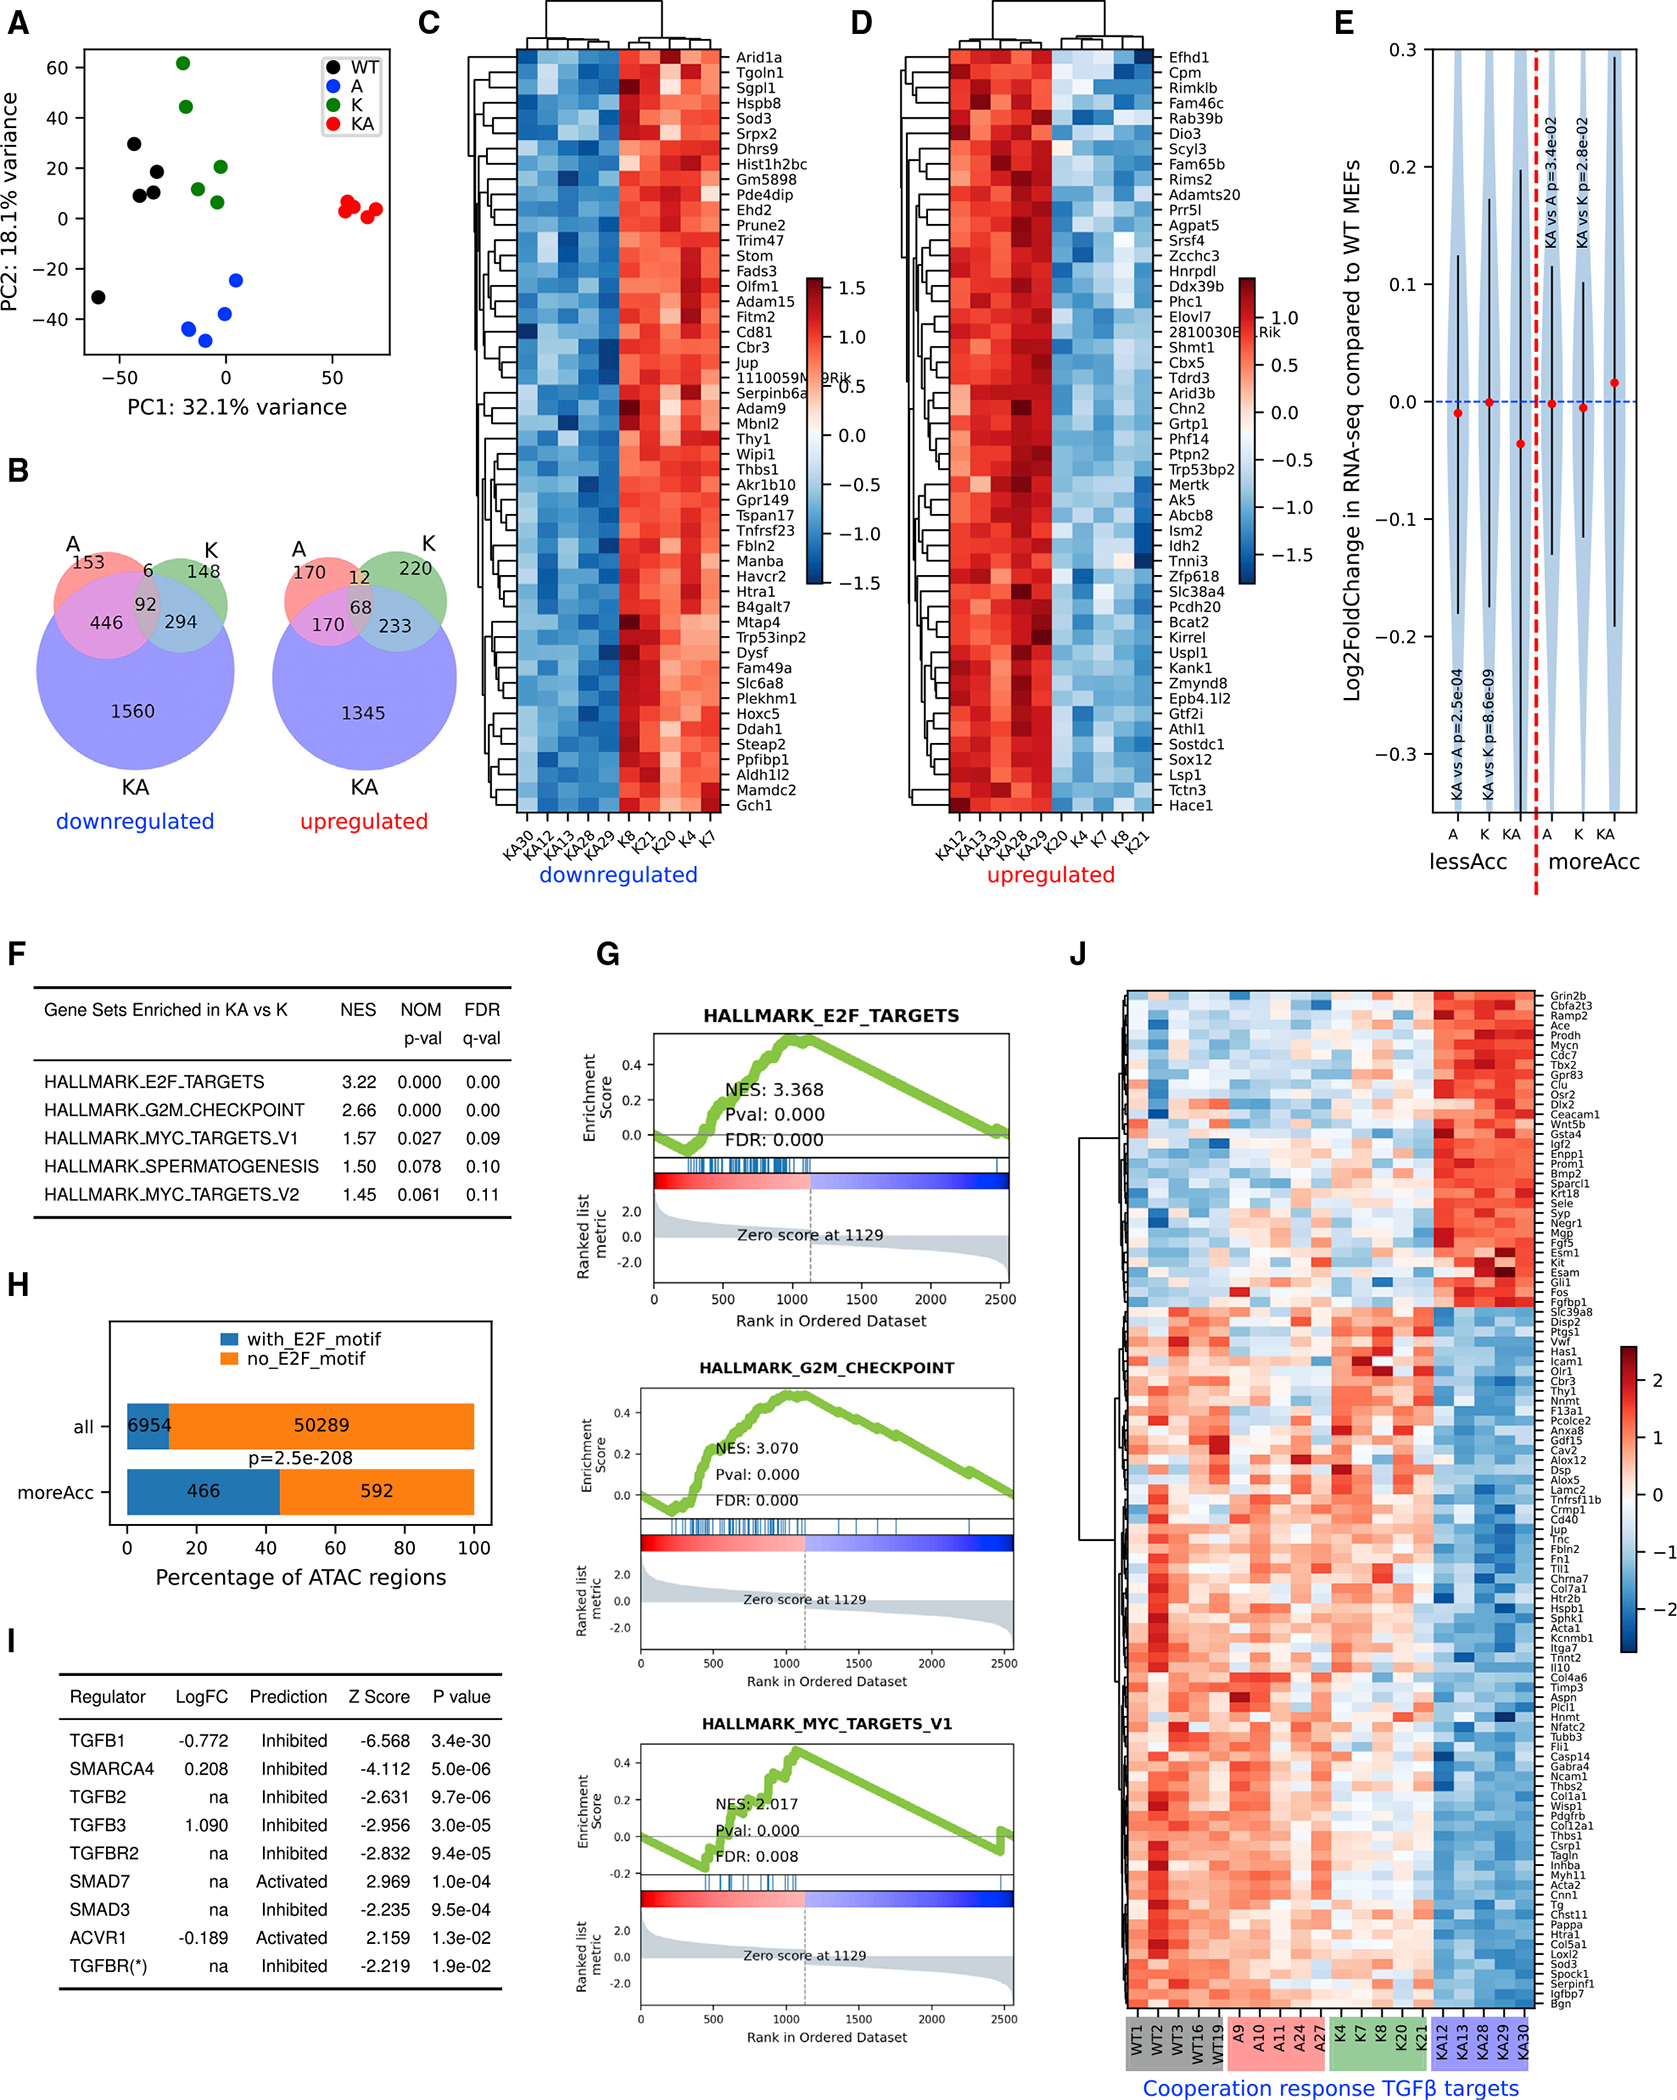
Figure 3. RNA-seq reveals specific gene expression changes in response to oncogenic Kras activation and Arid1a deletion.

(A) Principal-component analysis using log2 transformed RNA-seq normalized count matrix of Ad5-CMV-Cre recombined MEFs.
(B) Venn diagram of significantly up- (left) and down (right)-regulated genes when MEFs of 3 genotypes (A, K, and KA) are compared to WT MEFs. The significantly differentially expressed genes (DEGs) are defined using criteria of adjusted p < 0.05 and log2 fold change >0.5 or <−0.5.
(C and D) Heatmap of top 50 most significantly downregulated (C) and upregulated (D) genes in KA versus K. Row-wise Z scores of RNA-seq DESeq2-normalized counts in the log scale were clustered and plotted in the heatmap.
(E) Violin plot showing average log2 fold change of RNA-seq signal for nearest genes of less (left of the red dashed line) and more (right of the red dashed line) accessible regions. Student’s t tests, p values are indicated in the plot.
(F) Top gene sets enriched in KA versus K DEGs pre-ranked by log2 fold change.
(G) GSEA plots for the selected gene sets as indicated in the titles. Normalized enrichment score (NES), p value (Pval), and false discovery rate (FDR) values were indicated within the plots.
(H) Homer analysis of E2F motifs in all ATAC regions versus moreACC regions. E2F motif-containing rate is significantly higher in moreAcc peaks than all ATAC peaks (chi-square test p < 0.001).
(I) Ingenuity Pathway Analysis (IPA) upstream regulator analysis of DEGs between KA versus K MEFs predicts inhibited TGF-β pathways and SWI/SNF components.
(J) Heatmap of RNA-seq signal of 103 TGFB1 targets revealing a pattern consistent with cooperation response genes (CRGs). CRGs were identified using CRG score of <0.9 (McMurray et al., 2008).
