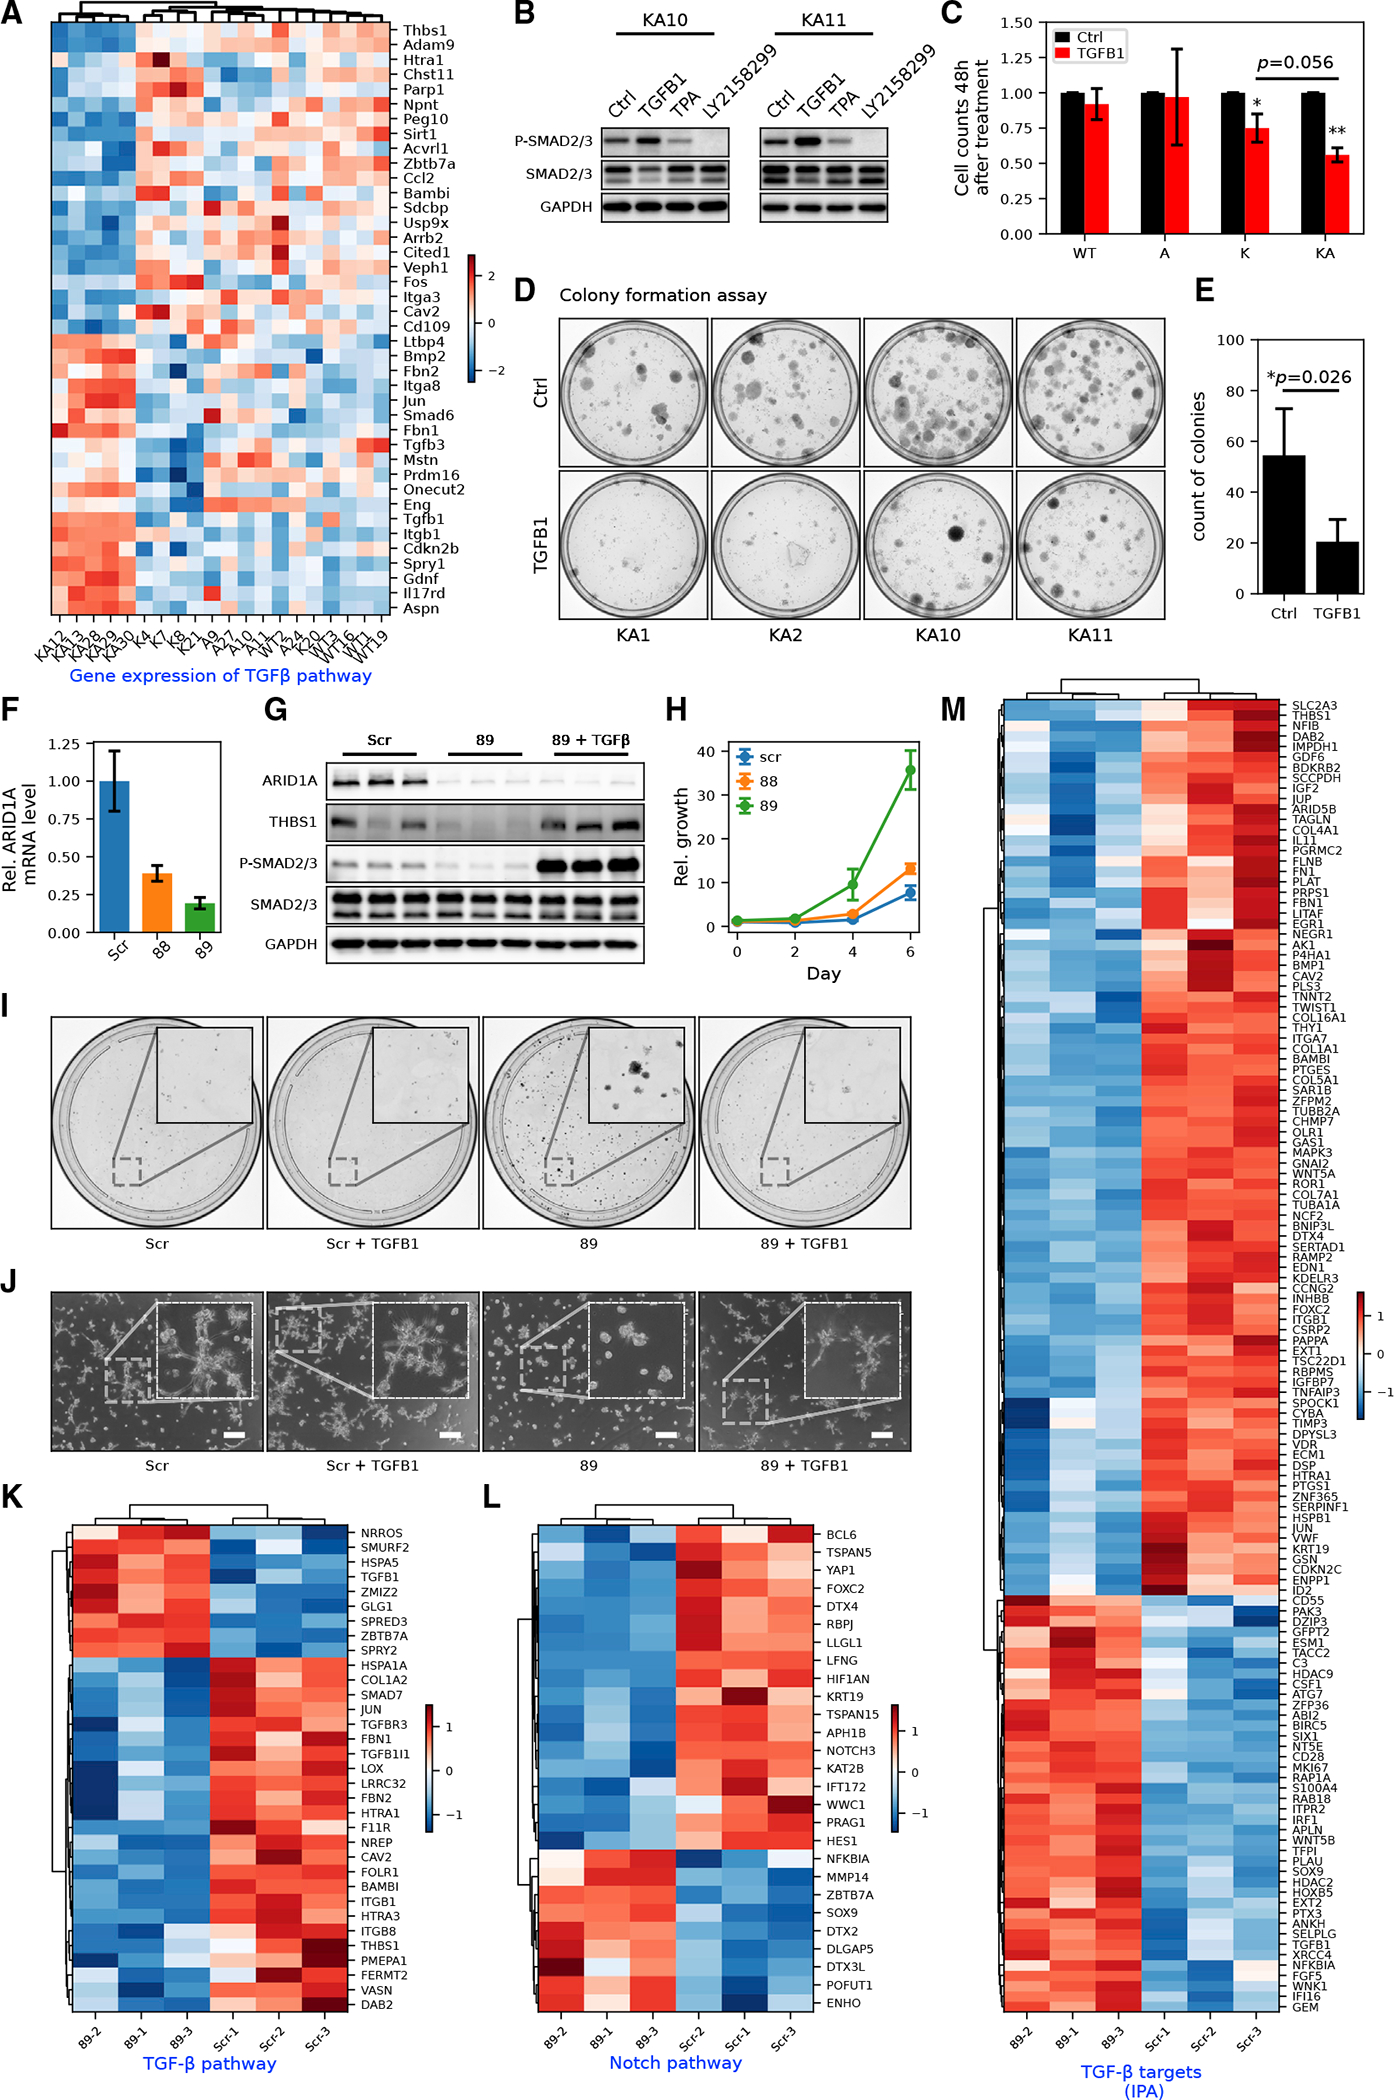
Figure 5. ARID1A is critical in upstream TGF-β pathway activation and cholangiocyte homeostasis.

(A) MEF RNA-seq heatmap of genes in the canonical TGF-β pathway (GO: 0007179). Row-wise Z scores of RNA-seq DESeq2-normalized counts in the log scale were clustered and plotted in the heatmap.
(B) Western blot of SMAD2/3 phosphorylation in KA MEFs with or without exogenous TGFB1 (10 ng/mL) or TGFB receptor inhibitor LY-2157299 (10 μM). See Figure S5A for detailed quantification.
(C) Cell counts of MEFs of different genotypes after 48 h of TGFB1 treatment (Student’s t tests, *p < 0.05, ** p < 0.01).
(D and E) Colony formation assay (D) and its quantification (E) in KA MEFs (n = 4 cell lines) with or without exogenous TGFB1 treatment (Student’s t tests, *p < 0.05).
(F) RT-qPCR showing the knockdown (KD) efficiency of shARID1A constructs 88 (Student’s t test, p < 0.01) and 89 (p < 0.01) in MMNK1 cells.
(G) Western blot showing decreased expression of THBS1 and phosphorylation of SMAD2/3 in MMNK1 cells with ARID1A KD and rescue with active TGFB1 treatment. Quantification of protein bands was shown in Figure S5D.
(H) Growth curve of MMNK1 cells with or without ARID1A KD measured by crystal violet absorbance (n = 3).
(I) Representative images from colony formation assay of MMNK1 control and ARID1A KD cells with or without TGFB1 treatment (n = 3).
(J) Representative images from tubule formation assay of MMNK1 control and ARID1A KD cells with or without TGFB1 treatment (n = 3). Scale bar, 200 μm.
(K) RNA-seq heatmap for DEGs in the TGF-β receptor signaling pathway (GO: 0007179) in MMNK1 control versus ARID1A KD cells.
(L) RNA-seq heatmap for DEGs in Notch signaling pathways (GO: 0007219) in MMNK1 control versus ARID1A KD cells.
(M) RNA-seq heatmap for TGF-β targets (from IPA) in MMNK1 control cells versus ARID1A KD cells.
