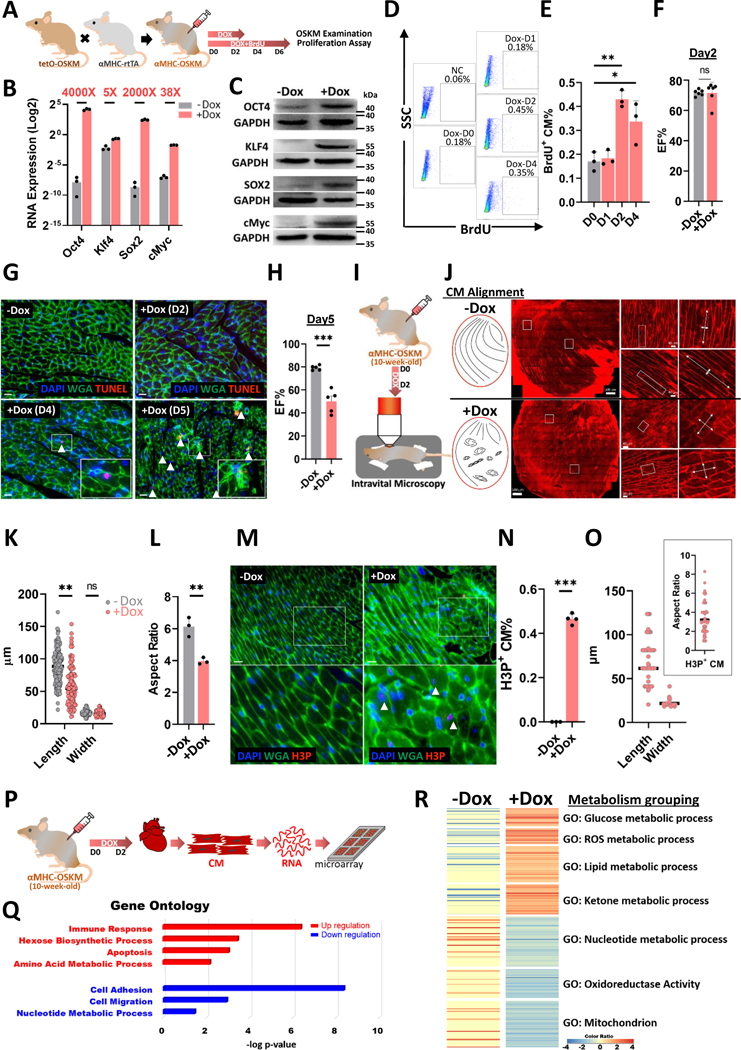
Figure 1. In vivo CM-reprogramming induces metabolic switch, CM dedifferentiation and increased CM proliferation.
A, The experimental design for investigating adult CM reprogramming in vivo. B, RNA expression level and induction level of OSKM in adult CMs after inducing OSKM reprogramming for 2 days. C, Protein expression level and induction level of OSKM in adult CMs after inducing OSKM reprogramming for 2 days. D, Flow cytometry analysis of isolated proliferative CMs through BrdU tracking in CM-reprogramming mice after OSKM induction. E, Percentage of proliferative CMs at each CM-reprogramming day determined by flow cytometry. F, Heart function measured by echocardiography in control or CM-reprogramming hearts after doxycycline treatment for 2 days. G, TUNEL staining of heart sections isolated from CM-OSKM mice after doxycycline treatment at the different time points. H, Heart function measured by echocardiography in control or CM-reprogramming hearts after doxycycline treatment for 5 days. I, Schematic diagram of intravital imaging protocol used for live investigating CM-reprogramming hearts after PBS or OSKM induction in vivo for 2 days. J, Investigation of CM alignment in the whole CM-reprogramming hearts by intravital microscopy after PBS or OSKM induction in vivo for 2 days. K, The morphology of CMs in CM-reprogramming hearts determined by length and width in intravital imaging data after PBS or OSKM induction in vivo for 2 days. Each dot represents one CM in one Ctrl or reprogramming heart. L, Aspect ratio determined by length-to-width ratio of each CM-reprogramming mouse in intravital imaging data after PBS or OSKM induction specifically in CMs in vivo for 2 days. Each dot represents one mouse sample. M, Immunofluorescence staining of heart tissue sections showing morphology of proliferative CMs through H3P and WGA staining on CM-reprogramming hearts after PBS or OSKM induction for 2 days. Arrow heads represented H3P+ proliferative CMs. Scale bars were 50 μm. N, Percentage of proliferative CM percentage (H3P+ %) in the heart tissue sections of CM-reprogramming hearts after PBS or OSKM induction for 2 days. O, The morphology of H3P+ CMs in three CM-reprogramming hearts determined by length, width, and aspect ratio in heart tissue sections after OSKM induction in vivo for 2 days. Each dot represents one CM in one Ctrl or reprogramming heart. P, The experimental design for discovering the detail mechanism for adult CM reprogramming at day 2 by microarray analysis. Q, Gene ontology analysis of gene expressional changes in adult CMs after PBS or OSKM induction for 2 days in vivo. R, Heat map showing metabolism-related gene expressional changes in adult CMs after PBS or OSKM induction for 2 days in vivo.

