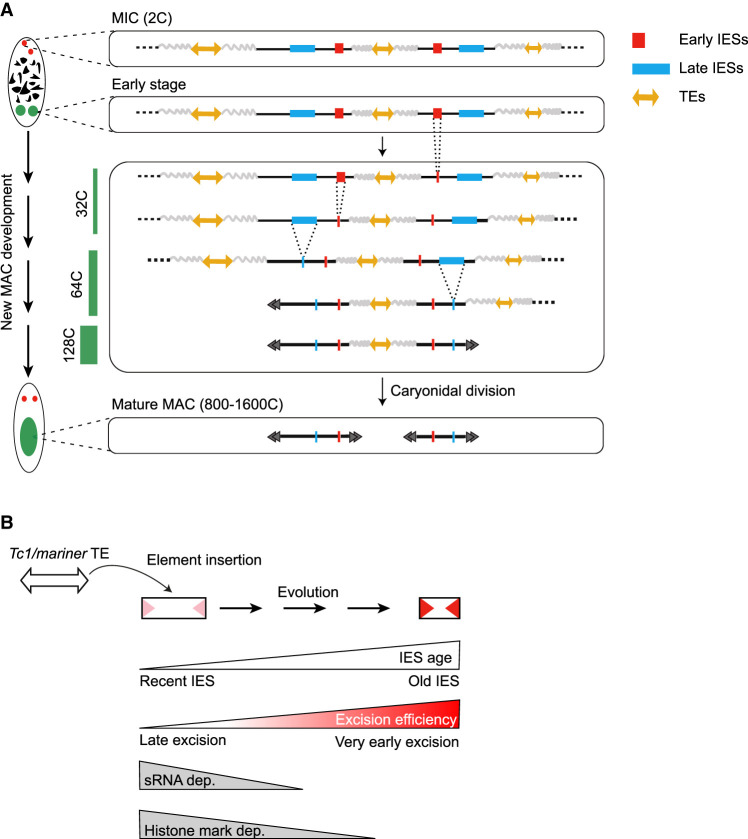
Figure 5.
Schematic view of DNA elimination timing in Paramecium and a model for IES evolution. (A) Relative timing of DNA amplification and PDE during new MAC development. The wavy gray lines stand for imprecisely eliminated sequences. The endoreplication level (C-level) is indicated as a green bar on the left. The black double arrowheads schematize the telomeric ends of MAC chromosomes. At each step of PDE, only one representative copy of the new MAC genome is drawn. (B) Model for evolutionary optimization of IESs. Old IESs have become independent of sRNAs and histone mark deposition for their excision. They have acquired strong sequence information at their ends (red arrowheads), promoting their efficient excision.

