Figure 3.
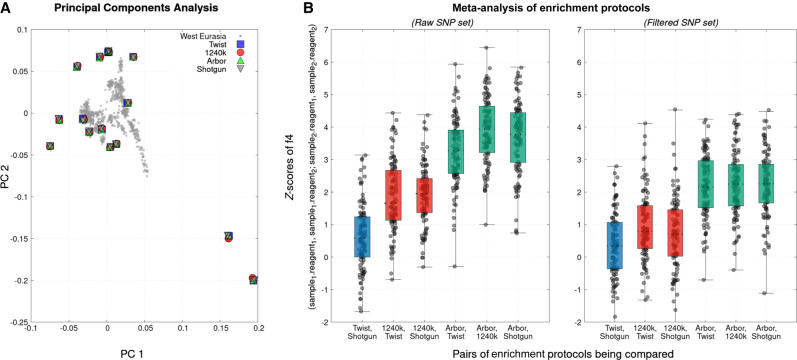
Population genetic effects of enrichment and an effective filter for reducing bias. (A) Projection of data from 15 libraries in the last rows of Table 1 onto a PCA of modern West Eurasians (gray squares) shows nearly identical positions regardless of data source. (B) We compute symmetry statistics of the form f4(library 1 − reagent 1, library 1 − reagent 2; library 2 − reagent 1, library 2 − reagent 2) and plot Z-scores for all 105 = 15 × 14/2 pairwise comparisons of the libraries (box-and-whisker plots show range, 25th and 75th percentiles, and mean). The statistics involving Arbor Complete are shown in green; remaining comparisons involving 1240k are shown in red; and the Twist–shotgun comparison is in blue. We show results both for all SNPs targets (left) and after applying the bias filter retaining a subset of 42% of autosomal SNPs (right). Results for this figure reflect data after removal of duplicated sequences.

