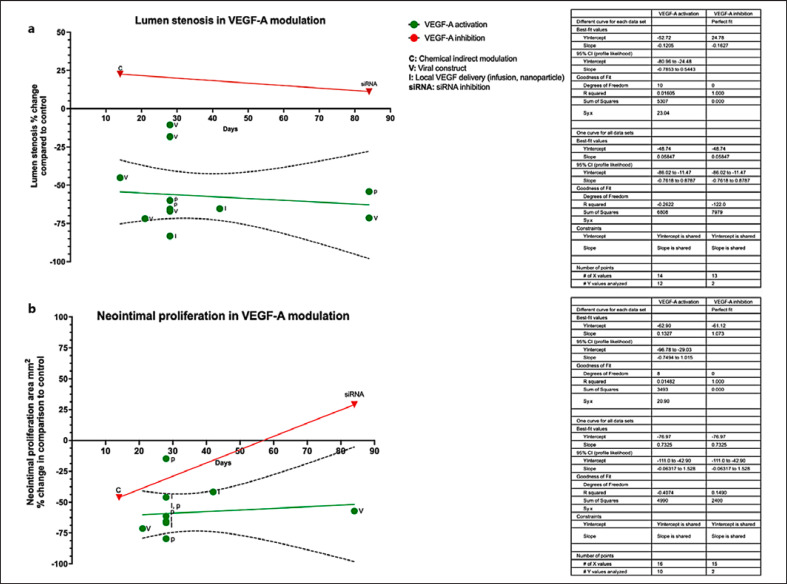
Fig. 2.
a Percentage change of arterial lumen stenosis and of neointimal proliferation area across animal studies, histogram, and best fit lines. X-axis depicts the percentage change in arterial lumen stenosis following VEGF modulation (increase or decrease) observed in the experimental group versus the matched control group per study. Data displayed here reflect experimental data stemming from animal studies only. Green dots represent the results of studies attempting activation of VEGF-A, while those attempting inhibition are represented by red dots. Percentage change was calculated in relevance to the control group of each study. Y-axes depict duration of experiment and day of data reporting (days) per study. Mechanism of VEGF modulation is depicted as initial letters, where C is chemical modulation (activation or inhibition) of VEGF; V delivery of VEGF by viral transfection construct; I local infusion of VEGF protein; siRNA inhibition of VEGF by silence RNA (RNA interference). Linear regression and 95% CI asymptotic slopes (dashed lines) are depicted, where applicable. a VEGF-A activation; Y intercept −60.92 (slope 95% CI [asymptotic] −0.51 to 0.93), VEGF-A inhibition Y intercept (line) 11.97. b VEGF-A activation Y intercept −64.37 (line) (slope 95% CI [asymptotic] −0.58 to 0.67), VEGF-A inhibition Y intercept (line) 51.74. Graph was generated with GraphPad Prism V. 9.

