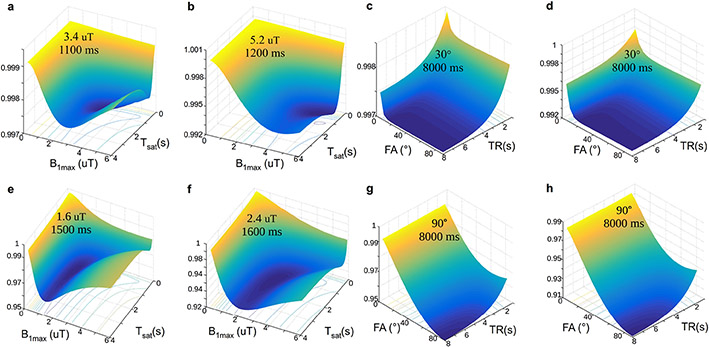
Figure 10. Dependence of the discrimination loss on the acquisition parameters used in CEST-MRF.
The surface plots with projected loss iso-contours describe the effect of the maximal saturation power (B1max) and the saturation time (Tsat) (a-b) or the flip angle (FA) and TR (c-d) on the loss, for a 3-pool water/amide/semisolid MT imaging scenario (a, c) and a 2-pool scenario with a dilute solute in the medium to fast exchange rate regime (b, d). In all images, the z-axis represents the loss (lower values indicate improved parameter discrimination ability), which is also color coded from blue to yellow. The optimal combination for each examined parameter pair is given in the surface plot. (e-h). A similar analysis was performed using the Euclidean distance instead of the dot-product reconstruction metric with an Euclidean distance based loss function. Note the different optimal parameters obtained. Reproduced and modified with permission from Perlman et al. Magn Reson Med. 2020;83:462-478.77

