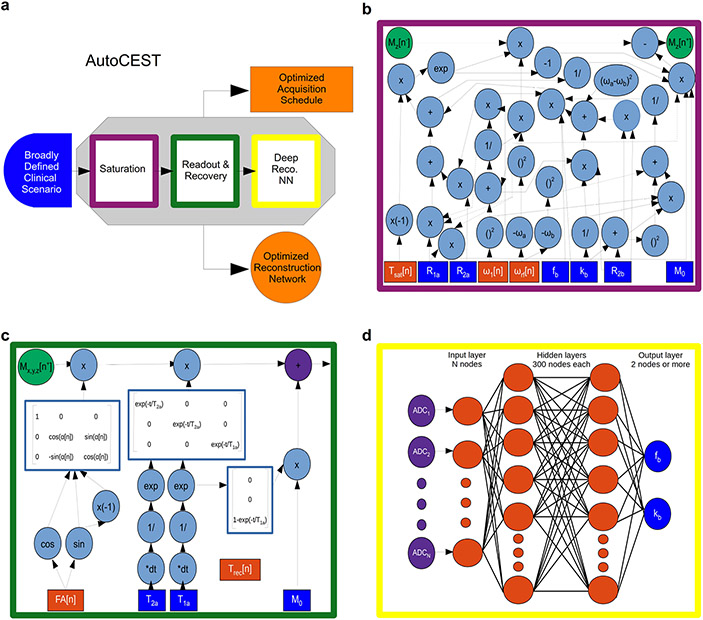
Figure 11. An end-to-end AI-based framework for automatic optimization of semisolid MT/CEST MRF acquisition protocols and quantitative deep reconstruction (AutoCEST).
a. Schematic representation of the optimization pipeline. A broadly defined tissue-parameter scenario serves as input to the pipeline which consists of sequential simulations of the CEST saturation (purple), readout and recovery (green), and deep reconstruction (yellow). AutoCEST outputs an optimized acquisition schedule and a reconstruction network (orange). b. CEST saturation block as a computational graph. The blue rectangles represent the input tissue parameters: initial magnetization (M0), water relaxation rates (R1a, R2a), solute transverse relaxation (R2b), exchange-rate (kb), and volume fraction (fb). The orange rectangles represent the dynamically updated protocol parameters: saturation time (Tsat), saturation power (ω1), and saturation frequency offset (ωrf). The graph calculates the magnetization at the end of the saturation block Mz[n+]. c. Bloch equation-based image readout as a computational graph. The blue rectangles represent the water-pool parameters, while the orange rectangles represent the dynamically updated protocol parameters: flip angle (FA) and recovery time (Trec), which is embedded in the appropriate relaxation step. Note that this is a partial display due to space limitations. d. Deep reconstruction network for decoding the “ADC” MR signals (purple circles), obtained at c into CEST quantitative parameters (fb and kb, blue circles). Reproduced from Perlman et al. Magn. Reson. Med. 2022.82

