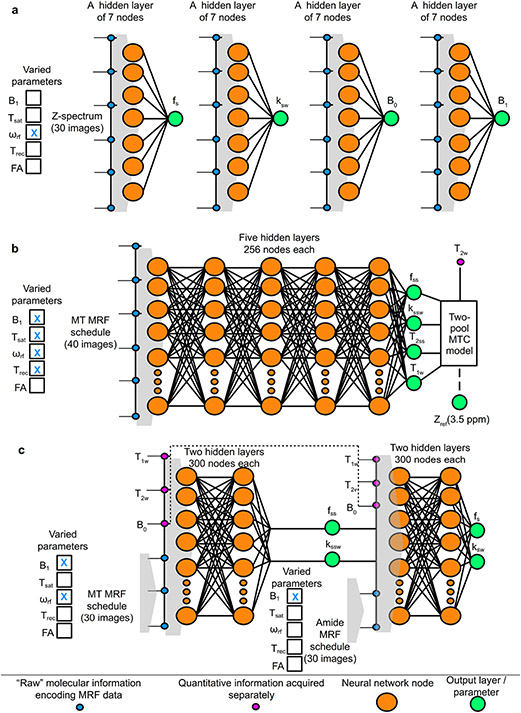
Figure 5. Supervised machine learning architectures for semisolid MT/CEST MRF.
a. Quantification of phosphocreatine (pCr) exchange parameters using an artificial NN composed of a single hidden layer.70 The input layer was fed with Z-spectrum measurements (analogous to a CEST-MRF schedule where the varied parameter is the saturation pulse frequency offset (ωrf), and the output was either the pCr proton volume fraction (fs), exchange rate (ksw), (B0), or transmit field (B1). The NN had 4 variants that were fed with the same input but trained to output each of the 4 different sought-after parameters, using a simulated dictionary. b. Brain semisolid MT exchange parameter quantification and background semisolid MT (Zref) contrast image synthesis,73 using a fully connected neural network. The input MRF schedule varied the saturation pulse power (B1), duration (Tsat), ωrf, and the recovery time (Trec). The output included the semisolid MT parameters, and a synthesized MT reference image at 3.5 ppm, calculated by plugging in the resulting parameters and the water T2-values obtained from a separate protocol in the two-pool BM equations solution. c. Sequential and deep CEST and semisolid MT quantification in the brain.15 A semisolid MT-oriented MRF acquisition schedule, which varies ωrf and B1, yields 30 images that are fed volxelwise into the first NN, together with the quantitative water pool and field homogeneity maps (T1, T2, B0). This NN map the semisolid MT pool exchange parameters, which are then fed, together with the previously obtained quantitative data into the second NN, ultimately yielding the amide proton fs and ksw.

