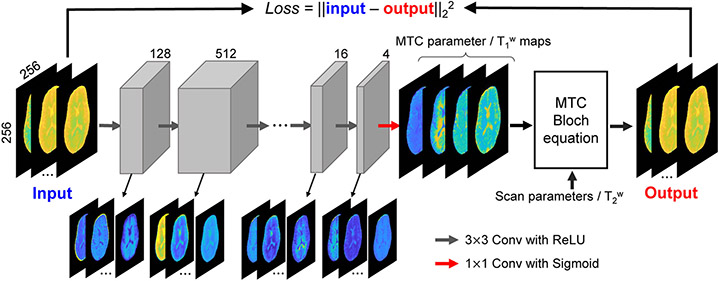
Figure 8. Unsupervised machine learning approach for semisolid MT/CEST MRF.
The raw MRF images are given as input to an 8-layer CNN, yielding quantitative semisolid MT exchange parameter and water T1 maps. Gray boxes represent feature spaces with the depth of the spaces indicated above each box. Colored arrows show the receptive field size of the kernel and the activation function. The estimated quantitative maps, the MRF schedule parameters, and a separately acquired water T2 map are plugged into the BM equations analytical solution, generating an estimation of the original semisolid MT MRF raw images. These output images are compared to the experimentally acquired raw MRF data (using the L2 loss function), allowing for the optimization of the semisolid MT parameter maps. Reproduced and modified with permission from Kang et al. Magn Reson Med. 2021;85:2040-2054.75

