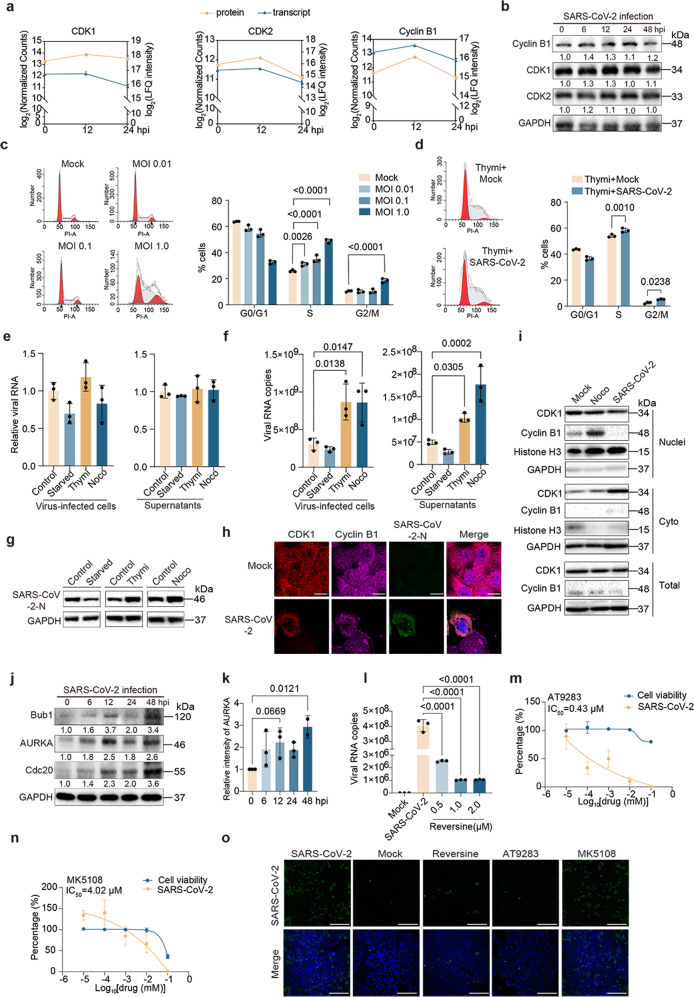
Fig. 1.
Transcriptome and proteome reveals host cell cycle checkpoint as antiviral target for SARS-CoV-2. a Log2 fold change profiles of mRNA and protein levels of CDK1 (Cyclin-dependent kinase 1), CDK2 and cyclin B1 in Caco-2 cells infected with SARS-CoV-2. b Caco-2 cells were infected with SARS-CoV-2 at the MOI of 0.01. The cells were collected at 0, 6, 12, 24, and 48 hpi and the indicated proteins were analyzed by immunoblots. c Caco-2 cells were mock-infected or infected with SARS-CoV-2 at the MOI of 0.01, 0.1 and 1.0, respectively. After 48 h, cells were harvested and the cell cycle was analyzed by flow cytometry. Three independent experiments were conducted, and the data were shown in the column graphs. d Caco-2 cells synchronized to the S phase by 0.85 mM thymidine (Thymi) were mock-infected or infected with SARS-CoV-2 at the MOI of 0.1. After 48 h, cells were collected to analyze the cell cycle by flow cytometry. Three independent experiments were conducted, and the data were shown in the column graph. e–g Caco-2 cells were grown in a medium with no serum, 0.85 mM Thymi, or 50 ng/ml nocodazole (Noco) to block cells in the G0/G1, G2/M and S phases, the cells were then mock-infected or infected with SARS-CoV-2 at the MOI of 0.1, cells and supernatants were harvested after 30 min (e) or 48 h (f, g). The mRNA level of SARS-CoV-2 nucleocapsid (N) was examined by qPCR (e, f), and the protein level of SARS-CoV-2 N was analyzed by immunoblot (g). h Caco-2 cells were mock-infected or infected with SARS-CoV-2 at the MOI of 0.01. After 48 h, the cells were fixed and stained with indicated antibodies. Red, CDK1 signal; Pink, cyclin B1 signal; Green, SARS-CoV-2 N signal; Blue, DAPI (the nuclear signal). Bar, 10 μm. i Caco-2 cells were mock-infected, infected with SARS-CoV-2 at the MOI of 0.01, or treated with 50 ng/ml nocodazole. After 48 h, the cells were harvested and the separated nuclear and cytoplasmic proteins were analyzed for cyclin B1 and CDK1 by immunoblot. j, k Caco-2 cells were infected with SARS-CoV-2 at the MOI of 0.01, cells were collected at 0, 6, 12, 24 and 48 hpi, and the indicated proteins were analyzed by immunoblot (j). Gray-scale statistical analysis of AURKA protein was examined by immunoblot using the Image J (k). l–n Caco-2 cells were mock-infected or infected with SARS-CoV-2 at the MOI of 0.01 and treated with the indicated concentrations of reversine (l), AT9298 (m) and MK5108 (n), the supernatants were collected at 48 hpi and viral copies was examined using qPCR. o Caco-2 cells were mock-infected or infected with SARS-CoV-2 at the MOI of 0.01 and treated with 2.0 μM reversine, 10 μM AT9298, 10 μM MK5108 or DMSO. The cells were fixed at 48 hpi and stained for the indicated proteins. Green: SARS-CoV-2 N protein signal; Blue, DAPI (the nuclear signal). Bar, 100 μm

