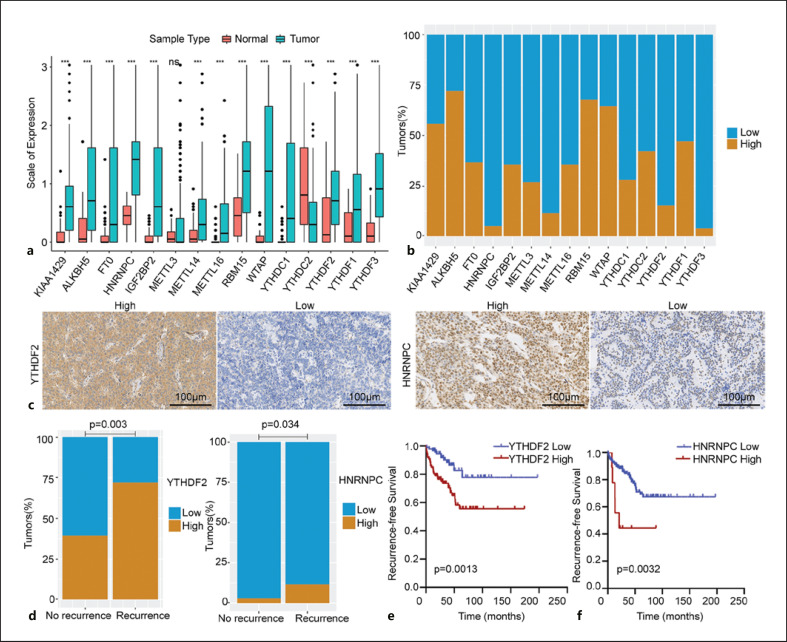
Fig. 1.
a Expression level of 15 m6A RNA regulators in tumor and adjacent normal tissues. *p < 0.05, **p < 0.01, and ***p < 0.001. b Hundred percent stacked bar chart showing the immunohistochemical expression pattern of each m6A protein. c Representative micrographs of IHC stained tissue sections for YTHDF2 and HNRNPC (×200 magnification). d Positive correlation of YTHDF2 and HNRNPC expression with PanNEN recurrence (p < 0.001 and p = 0.034, respectively). e Kaplan-Meier curves and log-rank tests showing the association between YTHDF2 and RFS. f Kaplan-Meier curves and log-rank tests showing the association between HNRNPC and RFS.

