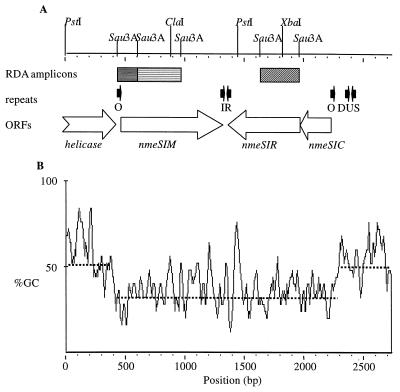
FIG. 1.
(A) Schematic representation of the NmeSI locus. Relevant restriction sites are indicated. Hatched bars, RDA fragments; open arrows, ORFs; solid arrows, repeats; O, 12-bp direct repeat, putative NmeSIC binding site (5); IR, 10-bp inverted repeat. (B) GC content of the NmeSI locus. Sliding windows with a size of 25 bp were used. Dotted lines, mean values.

