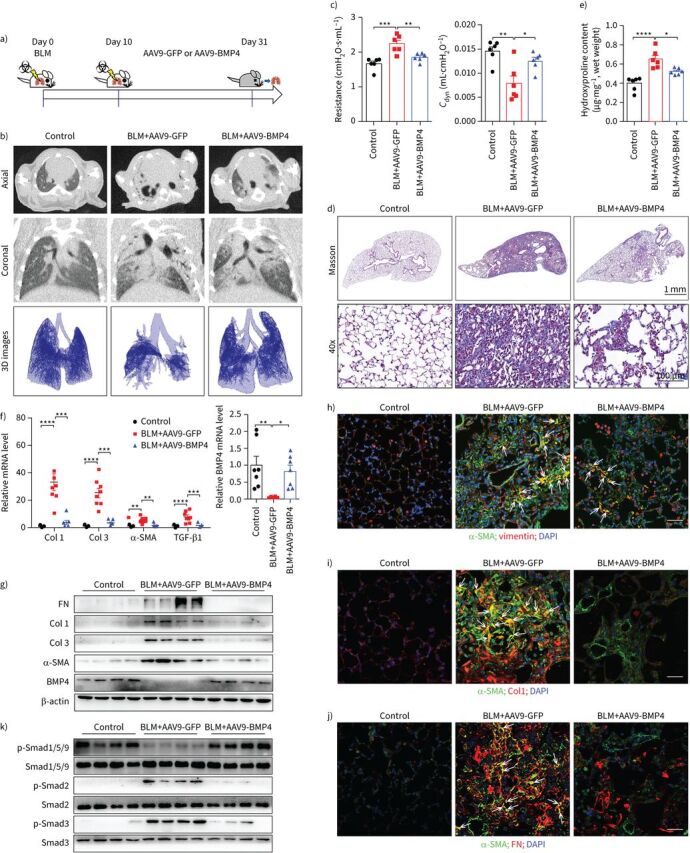
FIGURE 3.

Adeno-associated virus (AAV)9-bone morphogenetic protein (BMP)4 treatment reverses bleomycin (BLM)-induced pulmonary fibrosis. a) Schematic showing the overexpression of BMP4 in the therapeutic BLM mouse lung fibrosis model. Mice were injected intratracheally with AAV9-BMP4 (1.0×10¹⁰ viral genomes in 60 μL saline per mouse) starting at day 10, and lungs were assessed on day 31 after BLM (2.5 mg·kg−1) administration. b) Axial and their corresponding coronal micro-computed tomography (CT) images were acquired after BLM administration. The lower panels show the representative three-dimensional (3D) images drawn out from micro-CT images, based on different tissues with varying density (n=4 per group). c) Lung function parameters including respiratory resistance and dynamic compliance (Cdyn) among different groups were compared 21 days after virus instillation (n=6 per group). d) Masson's trichrome staining of lung sections from AAV9-BMP4- or AAV9-green fluorescent protein (GFP)-treated mice in the therapeutic mouse lung fibrosis model (n=6 per group). Scale bars=1 mm. Images in the lower panels were magnified from the photomicrographs in the upper panels. Scale bars=100 µm. e) Hydroxyproline contents in the lungs of AAV9-BMP4- or AAV9-GFP-treated mice in the therapeutic lung fibrosis model (n=6). f) Quantitative real-time PCR analysis of Col1, Col3, α-smooth muscle actin (SMA), transforming growth factor (TGF)-β1 and BMP4 mRNA expressions in the lungs of AAV9-BMP4- or AAV9-GFP-treated mice in the therapeutic lung fibrosis model (n=5∼8 per group). g) Representative Western blot analysis of α-SMA, Col1, Col3, fibronectin (FN) and BMP4 and k) expression of phosphorylated (p) and total Smad1/5/9, Smad2 and Smad3 in lung homogenates of AAV9-BMP4- or AAV9-GFP-treated mice in the therapeutic lung fibrosis model (n=4 per group). β-actin was used as a loading control. h–j) Immunofluorescence analysis of α-SMA, vimentin, FN and Col1 expressions in lung sections (nucleus, 4′,6-diamidino-2-phenylindole (DAPI); n=3 per group). Representative images of the staining are shown. Scale bars=50 µm. Yellow colouration indicates representative double-positive cells. Data are presented as mean±sem. *: p<0.05; **: p<0.01; ***: p<0.001; ****: p<0.0001.
