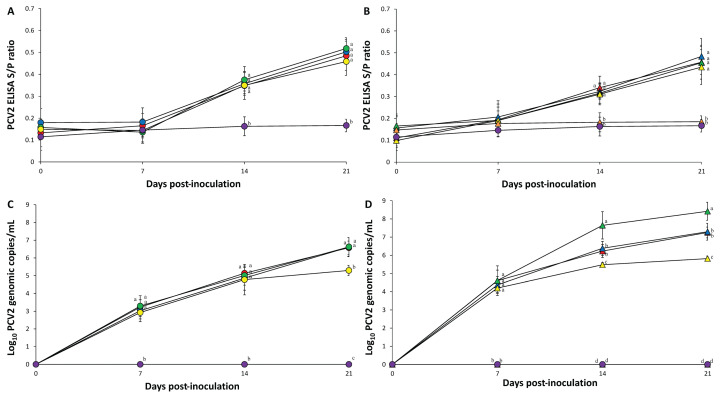
Figure 2.
A − Porcine circovirus type 2 (PCV-2)-specific ELISA antibody levels in serum of pigs from PCV-2a (
 ), PCV-2b (
 ), PCV-2d (
 ), PCV-2e (
 ), and negative control (
 ) groups. B − PCV-2-specific ELISA antibody levels in serum of pigs from PCV-2a/PRRSV (
 ), PCV-2b/PRRSV (
 ), PCV-2d/PRRSV (
 ), PCV-2e/PRRSV (
 ), PRRSV (
 ;), and negative control (
 ) groups. C − Mean values of the genomic copy number of porcine circovirus type 2 (PCV-2) DNA in serum of pigs from PCV-2a (
 ), PCV-2b (
 ), PCV-2d (
 ), PCV-2e (
 ), and negative control (
 ) groups. D − Mean values of the genomic copy number of porcine circovirus type 2 (PCV-2) DNA in serum of pigs from PCV-2a/PRRSV (
 ), PCV-2b/PRRSV (
 ), PCV-2d/PRRSV (
 ), PCV-2e/PRRSV (
 ), PRRSV (
 ), and negative control (
 ) groups. Variation is expressed as the standard deviation. Different superscripts (a, b, c, and d) indicate significant (P < 0.05) difference among either single-infected or dual-infected groups.

