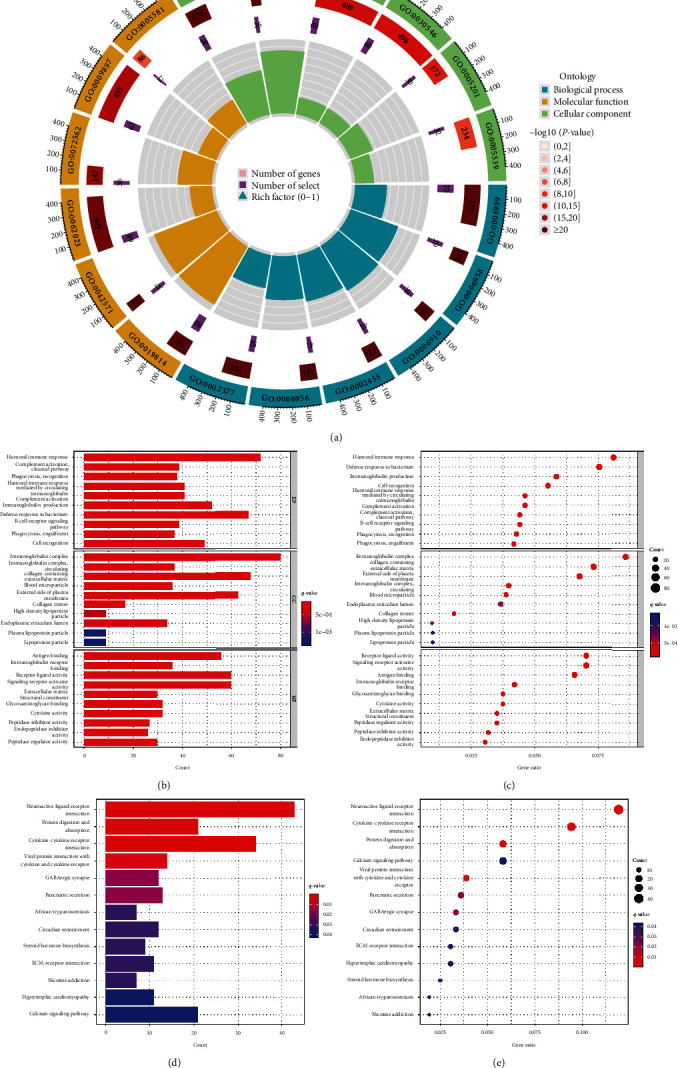
Figure 6.

GO/KEGG enrichment analysis of DEGs between high- and low-NUDT1 expression: (a–c) GO enrichment analysis; (d, e) KEGG enrichment analysis.

GO/KEGG enrichment analysis of DEGs between high- and low-NUDT1 expression: (a–c) GO enrichment analysis; (d, e) KEGG enrichment analysis.