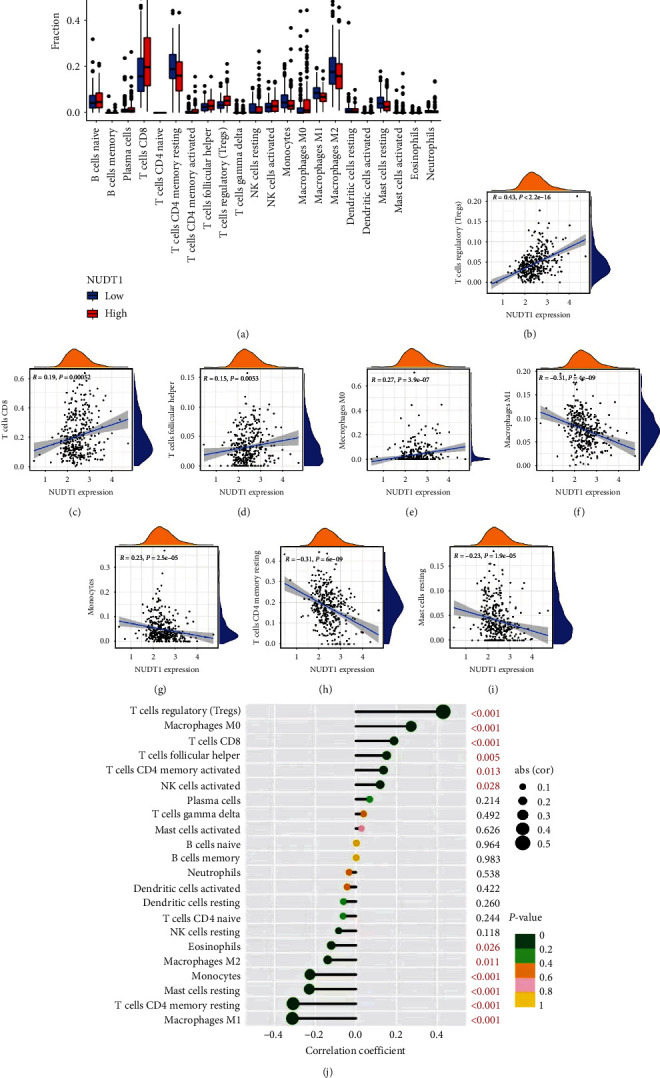
Figure 7.

Correlation analysis between NUDT1 and immune infiltration: (a) the infiltration levels of 22 immune cell subtypes in the high- and low-NUDT1 expression group; (b–j) the correlation between tumor immune infiltrated cell levels and NUDT1 expression in ccRCC. ∗P < 0.05, ∗∗P < 0.01, ∗∗∗P < 0.001.
