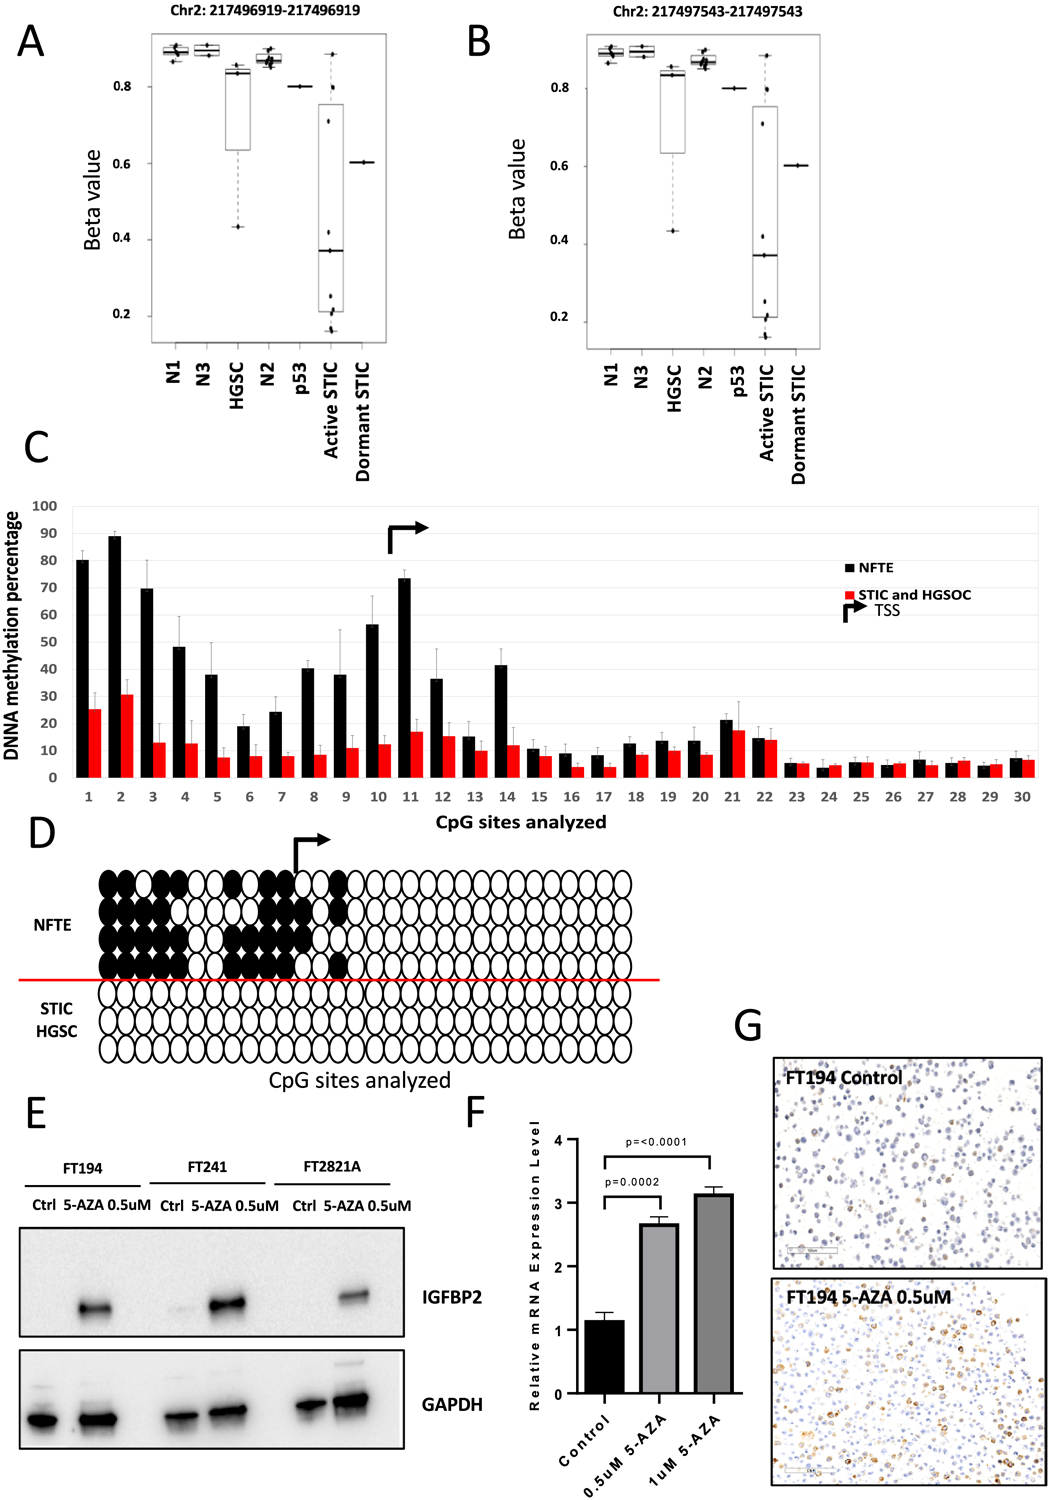
Figure 3. Hypomethylation of CpG sites upstream of IGFBP2 in precursor lesions is associated with IGFBP2 overexpression.

(A-B) DNA methylation status of the two CpG sites upstream of IGFBP2 identified by MethylationEPIC array in microdissected NFTE, precursor lesions, and HGSC. Each dot represents one sample. N1: NFTE immediately proximal to STIC; N2: NFTE distal to STIC; N3: NFTE from the contralateral fallopian tube; p53: p53 signature. (C) Pyrosequencing analysis showing DNA methylation status upstream of IGFBP2. TSS, transcription starting site. (D) Methylation of 40% in total CpG sites is used as a cutoff. White circles indicate unmethylated cytosines and black circles indicate methylated cytosines within CpG sites. (E) Immunoblots showing IGFBP2 expression levels in cellular extracts of FT194, FT241, and FT2821A cells after treatment with 5-AZA for 24 hours. GAPDH is used as a loading control. (F) qRT-PCR of IGFBP2 in FT194 after treated with 0.5 μM or 1 μM 5-AZA for 24 hours. (G) Immunostaining of IGFBP2 in FT194 cells after treatment with 0.5 μM 5-AZA for 24 hours.
