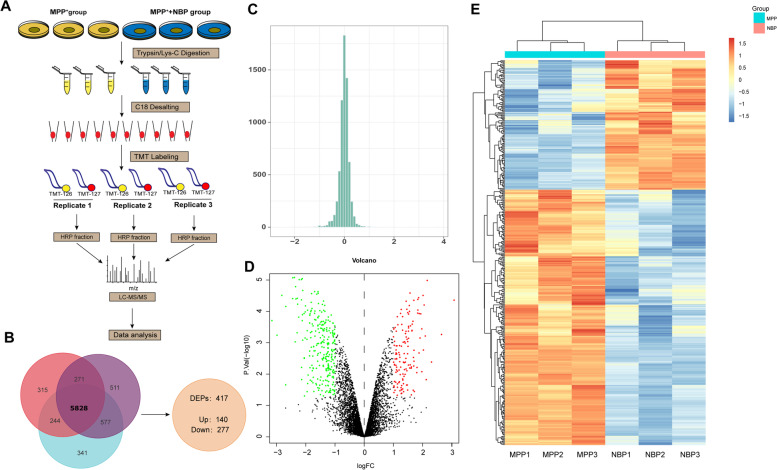
Fig. 2.
The quantitative proteomics analysis of the protective effect of Dl-3-n-Butylphthalide (NBP). (A) The proteomics workflow for the current study. (B) In N2a cells which were stimulated with mpp+ (500 μM) in the absence or presence of NBP (40 μM) for 24 h, a total of 5829 proteins were identified in three replicates. Using the cut off of |fold-change|> 1.5 and p value < 0.05 to determine DEPs, we qualified 417 proteins and determined 277 increased and 140 decreased. (C) Overall distribution of the ratios of 5829 proteins in the quantitative proteomics with three replicates. (D) Volcano plot of mpp + -treated group and NBP group. The volcanic map was drawn using two factors, the fold change (Log2) between the two groups of samples and the p value (− Log10) obtained by the t-test, to show the significant difference in the data of the two groups of samples. The red dots in the figure are proteins that are significantly differently up-regulated, and the green dots are proteins that down-regulated. Gray dots indicate non-significantly DEPs. (E) Heat map of DEPs ratio, each row represents a protein, each column represents the ratio of a sample to a reference sample, and the ratio takes the value of log2

