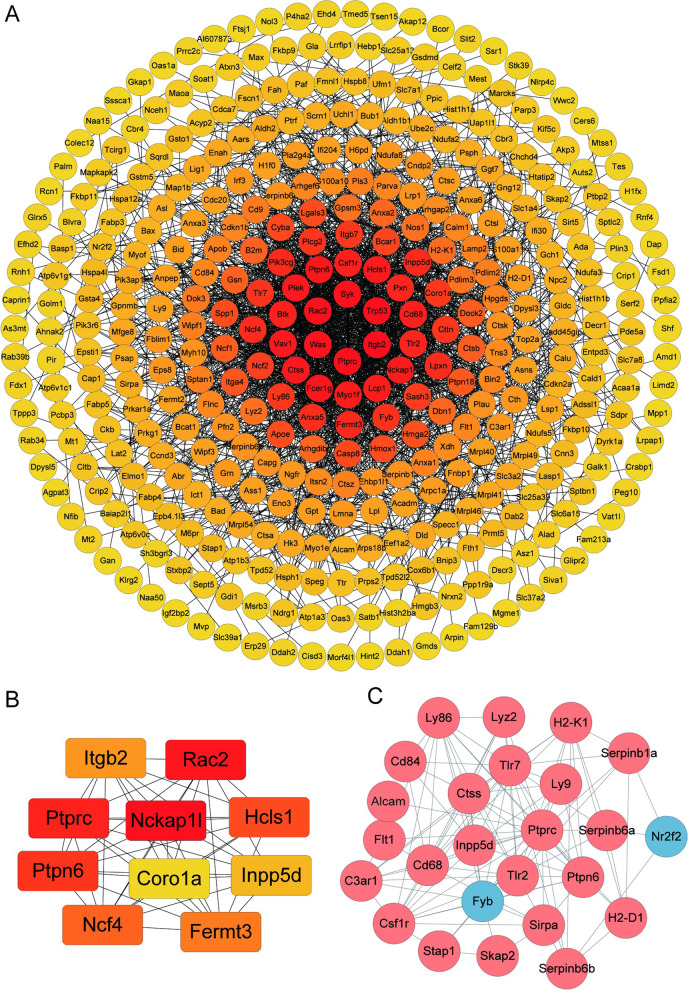
Fig. 5.
(A) Protein–protein interaction network consisting of 417 DEPs (B). The color saturation of the edges represents the confidence score of the association between modulated proteins. The top 10 proteins with the highest degree of PPI network connectivity were identified by the MMC method using CytoHubba. (C) The differentially regulated cluster I protein network is visualized using Cytoscape 3.8.0. The blue nodes indicate the significantly downregulated proteins and red nodes represent the significantly upregulated proteins (p < 0.05)

