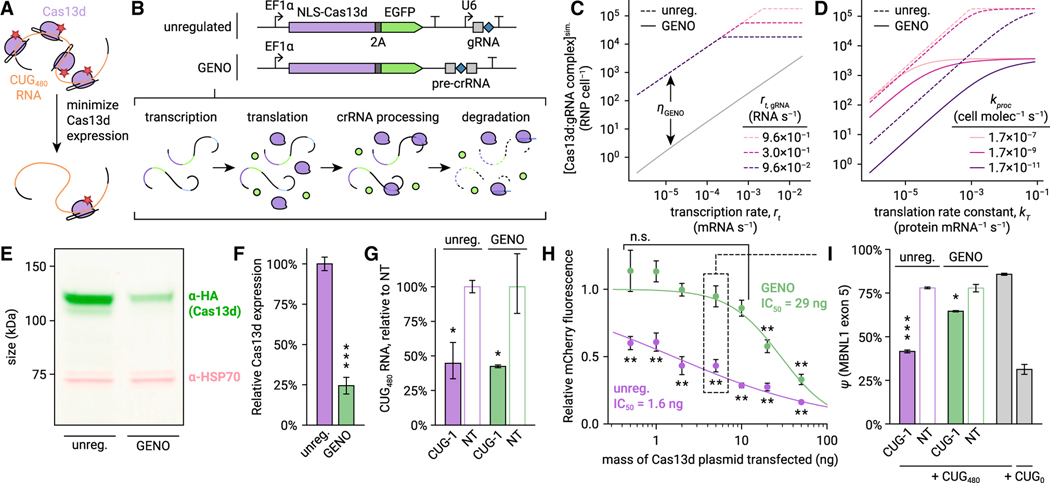
Figure 4. Negative autoregulation by gRNA excision reduces Cas13d collateral activity and retains on-target activity at CUGn RNA.
(A) Rationale for Cas13d autoregulation. Overexpression likely produces many activated Cas13d:gRNA complexes for each CUGn target RNA. Minimizing Cas13d expression may greatly reduce collateral activity with minimal loss of on-target activity.
(B) Description of GENO for regulation of Cas13d expression. In GENO, the pre-crRNA is placed in a UTR of the Cas13d mRNA, causing cleavage and degradation during crRNA processing.
(C) Simulation of steady-state concentration of Cas13d:gRNA complex in GENO (solid line) and unregulated (dashed lines) conditions as a function of Cas13d transcription rate (rt, horizontal axis) and gRNA transcription rate in the unregulated design (rt,gRNA, isolines). Autoregulation efficiency ƞGENO is annotated (see Data S1). Translation rate constant kT = 8.3 3 10−3 protein mRNA−1 s−1, crRNA processing rate constant kproc = 1.7 3 10−7 cell mol−1 s−1.
(D) Simulated Cas13d:gRNA concentration as a function of kT (horizontal axis) and kproc (isolines). rt = 0.02 mRNA s−1, rt,gRNA = 0.96 RNA s−1.
(E) Fluorescent western blot comparing Cas13d protein expression from unregulated and GENO plasmids transfected in HeLa. Cas13d is visualized with α-HA antibody (green), and HSP70 is included as a control (pink).
(F) Quantification of western blot. Error bars show SD. n = 3. ***p < 0.001, two-tailed t test.
(G) Ratio of CUG480 RNA to GAPDH mRNA after targeting CUG480 with unregulated or GENO-Cas13d in HeLa, normalized to NT. n = 3 transfections, averaged across two qPCR replicates. Error bars show SEM of ΔCq propagated to the plotted ratio. *p < 0.05, one-tailed t test of ΔCq.
(H) mCherry fluorescence relative to NT 20 h after transfection with unregulated (purple) and GENO (green) Cas13d and CUG-1 gRNA plasmids, CUG480 target, and mCherry, as a function of mass of Cas13d plasmid transfected. Error bars show SD. n = 3. Logistic fit functions shown as solid lines. **p < 0.01, two-tailed t test.
(I) MBNL1 exon 5 ψ measured by RT-PCR. Mass of Cas13d plasmid transfected matches the condition highlighted in (H). Error bars show SD. n = 3. *p < 0.05, **p < 0.01, ***p < 0.001, two-tailed t test.

