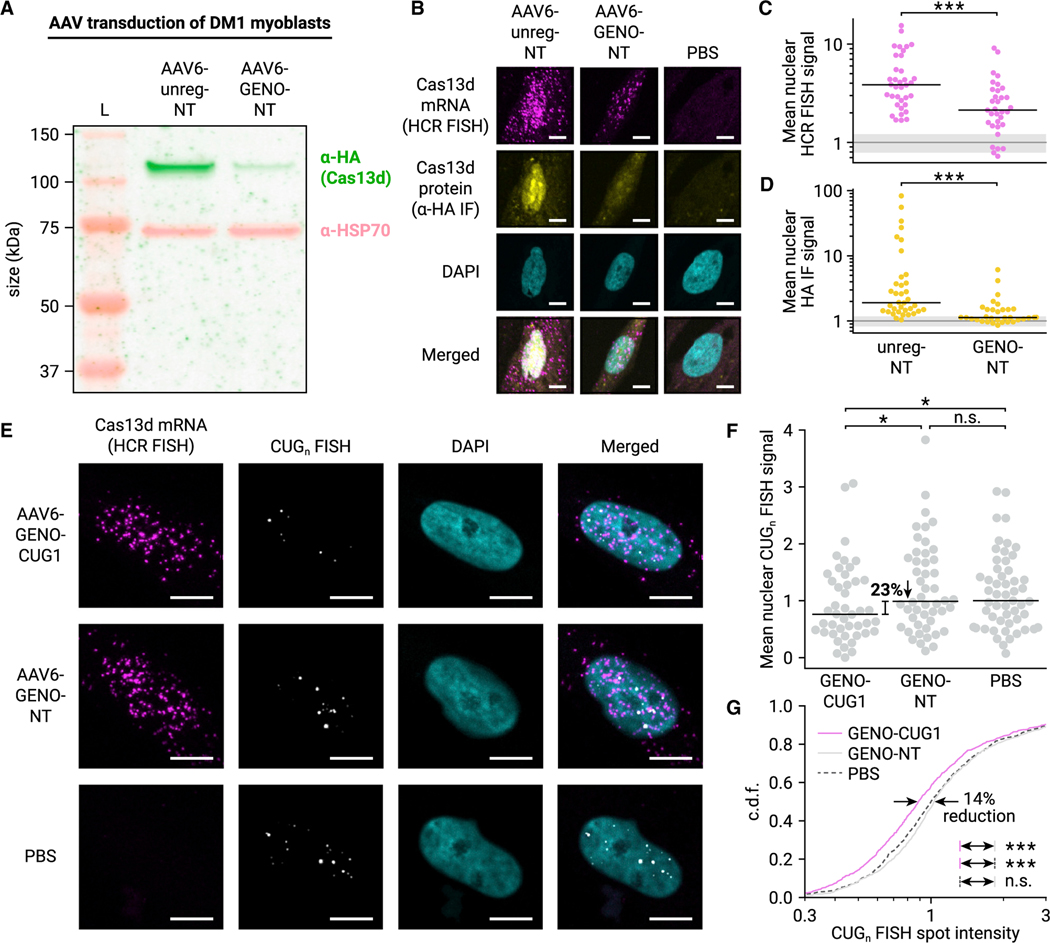
Figure 5. AAV-delivered autoregulated Cas13d reduces CUGn RNA accumulation in human DM1 myoblasts.
(A) Fluorescent western blot of Cas13d in AAV-transduced DM1 patient-derived myoblasts. Cas13d is visualized with α-HA antibody (green), and HSP70 is included as a control (pink). Protein ladder (L) is shown.
(B) Representative 20× confocal images of AAV-treated DM1 myoblasts stained for Cas13d mRNA (HCR FISH, magenta) and protein (α-HA IF, yellow). Nuclei stained with DAPI (cyan). Scale bars, 10 μm.
(C) Mean nuclear intensity of Cas13d HCR FISH in unregulated and GENO NT conditions. Dots represent nuclei, black line indicates median. n > 33 nuclei, >3 images. ***p < 0.001, two-sided Mann-Whitney U test. Gray line indicates mean baseline nuclear FISH signal in PBS-treated myoblasts, and gray shaded region indicates SD. n = 26 nuclei, 3 images.
(D) Mean nuclear intensity of α-HA IF in unregulated and GENO NT conditions. Dots represent nuclei, black line indicates median. n > 33 nuclei, >3 images. ***p < 0.001, two-sided Mann-Whitney U test. Gray line and shaded region calculated as in (C).
(E) Representative 40× confocal images of AAV-treated DM1 myoblasts stained for Cas13d mRNA (HCR FISH, magenta) and CUGn RNA (CAG10 FISH probe, grayscale). Nuclei stained with DAPI (cyan). Scale bars, 10 μm.
(F) Mean nuclear intensity of CUGn FISH in GENO targeting and NT conditions. Dots represent nuclei, black line indicates median. n > 43 nuclei, 21 images. *p < 0.05, one-sided Mann-Whitney U test.
(G) Cumulative distribution function (c.d.f.) of FISH spot intensity of individual CUGn RNA foci in GENO targeting (magenta, solid) and NT (gray, solid) conditions. PBS-treated condition is also shown (gray, dashed). n > 745 spots. ***p < 0.001, two-sided Mann-Whitney U test.

