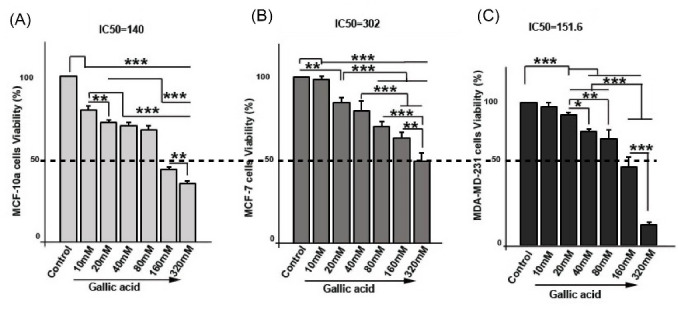
Fig. 1.

The cell survival rate of MCF-10a (A), MCF-7 (B), and MDA-MB-231 (C) was evaluated in response to Gallic acid at different concentrations by MTT assay. IC50 assay was performed after 48 h Gallic acid treatment by GraphPad (Prism) software. MCF-10a (IC50= 140 mM; A), MCF-7 (IC50= 302 mM; B), and MDA-MB-231 (IC50=151.6; C). One-way ANOVA with Tukey test. The data is the mean ± SD. *P < 0.05, **P < 0.01, ***P < 0.001.
